PARTITION BY versus GROUP BY
 Friday, June 5, 2009 at 1:30PM
Here’s some more research that I did for the book that didn’t make make the final content. It's a bit esoteric but interesting.
In some circumstances you can use PARTITION BY to avoid doing a self-join to a GROUP BY subquery. However, although the PARTITION BY avoids duplicate reads of the table – usually a good thing – it won’t always lead to better performance.
For instance, if I want to create a report that compares each sale value to the average sale value for the product, I might join the sales data to a subquery with a GROUP BY product_id:
WITH /*+ gather_plan_statistics gh_pby1*/
totals AS (SELECT prod_id,
AVG(amount_sold) avg_product_sold
FROM sales
GROUP BY prod_id)
SELECT prod_id, prod_name, cust_id, time_id, amount_sold,
ROUND(amount_sold * 100 / avg_product_sold,2) pct_of_avg_prod
FROM sales JOIN products USING (prod_id)
JOIN totals USING (prod_id);
Of course, that approach requires two full scans of the SALES table (I used an expanded non-partitioned copy of the SH.SALES table from the Oracle sample schema). If we use the PARTITION BY analytic function we can avoid that second scan:
SELECT /*+ gather_plan_statistics gh_pby2*/
prod_id,prod_name, cust_id, time_id, amount_sold,
ROUND(amount_sold * 100 /
AVG(amount_sold) OVER (PARTITION BY prod_name)
,2) pct_of_avg_prod
FROM sales JOIN products USING (prod_id) ;
You’d expect that avoiding two scans of SALES would improve performance. However, in most circumstances the PARTITION BY version takes about twice as long as the GROUP BY version. Here’s some output from Spotlight’s analyse trace module – you can get some of the same information from tkprof if you don’t have Spotlight:
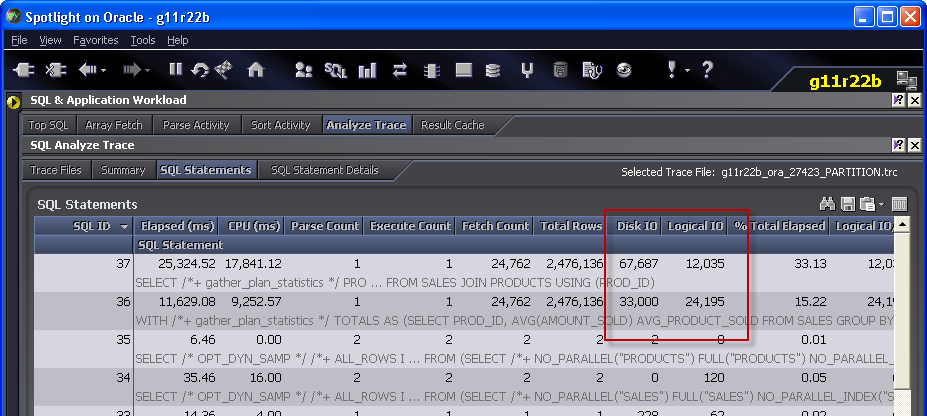
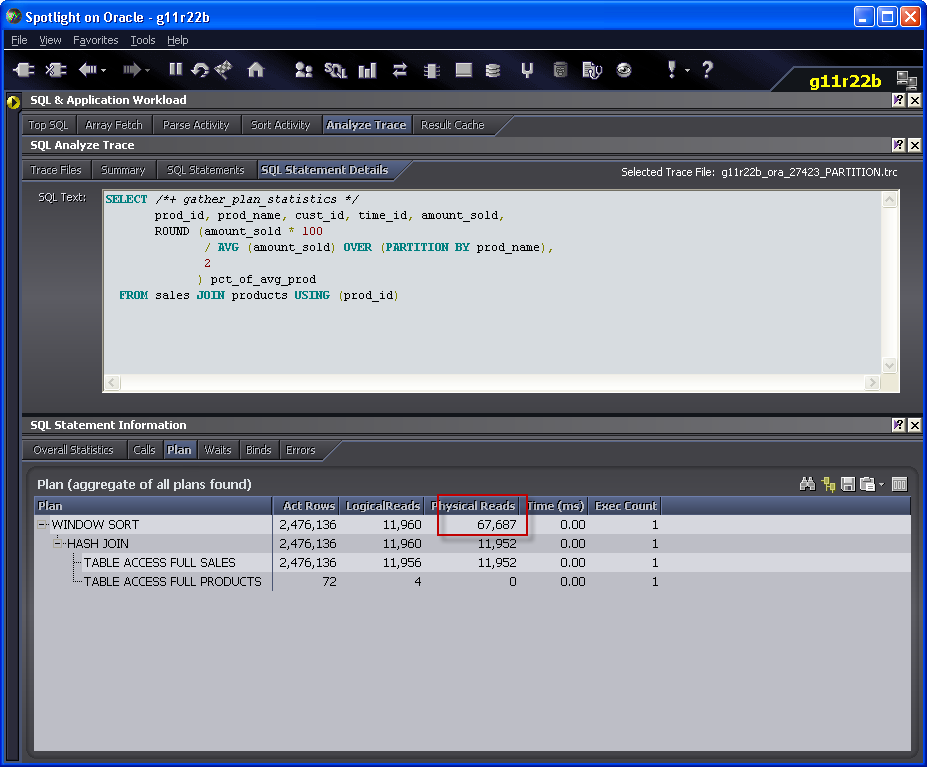
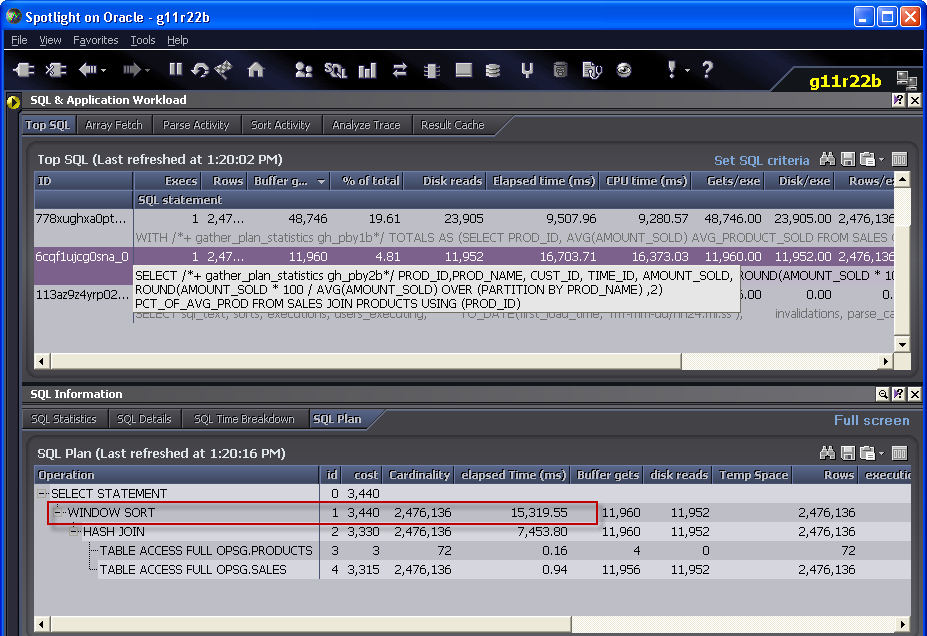
Notice how the version that uses the PARTITION BY clause has less logical IO but more physical IO. You might be thinking that this is something to do with buffer cache contents, but actually it’s a directly related to the WINDOW SORT Step that is characteristic of the analytic operation. You can see this in Spotlight when you look at the plan:
If you don’t have Spotlight, then you could see the same thing in tkprof, but you have to look closely at the step tags:
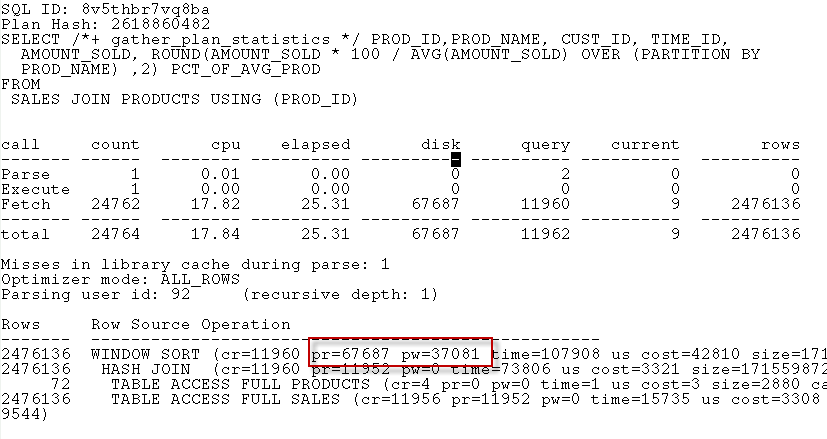
Analytic functions tend to be very memory intensive. The GROUP BY solution reads the SALES table twice, which requires some extra IO, but the PARTITION BY solution needs much more PGA memory. The default PGA allocation mechanisms – which limit the amount of memory available to individual processes and workeaas to a fraction of the overall PGA Aggregate Target- didn’t allocate enough memory for the operation to complete in memory and hence temporary segment IO resulted. As is so often the case, temporary segment IO overhead exceeded the datafile read overhead.
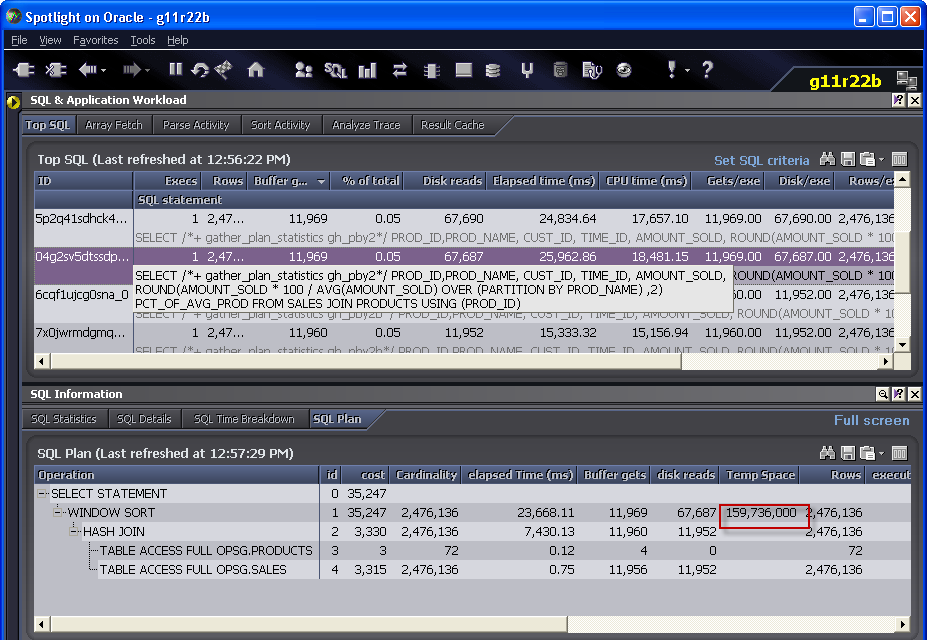
We can see how much memory was required by using DBMS_XPLAN.DISPLAY_CURSOR, looking at the V$SQL_PLAN entries or – if we have it – Spotlight:
To get it from DBMS_STATS, we could use the MEMSTATS option and provide the SQL_ID from V$SQL:
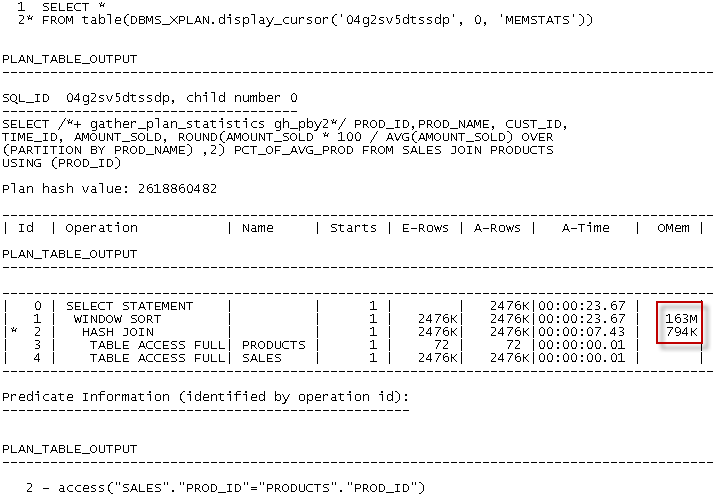
The memory wanted isn’t that much – only 163M – a trivial amount in this day and age. This database was running Automatic Memory Management (AMM) with a memory target of about 1.5GB. Oracle didn’t increase the PGA aggregate target even after I’d run this query (badly) several times, but still there was about 450M of PGA which should have been enough. Unfortunately, a single session cannot use all of the PGA target – under 1GB only 200M is available to a single serial session and only half that to a single work area.
In this circumstance I would probably be well advised to opt out of Automatic workarea management and set my own amount of sort memory: something like this:
ALTER SESSION SET workarea_size_policy = manual;
ALTER SESSION SET sort_area_size = 524288000;
(Jonathan lewis has reported a bug in this –see http://jonathanlewis.wordpress.com/2008/11/25/sas-bug/)
Once I do that, the temporary segment IO involved in the PARTITION BY reduces remarkably. However, it’s still slower than the GROUP BY.
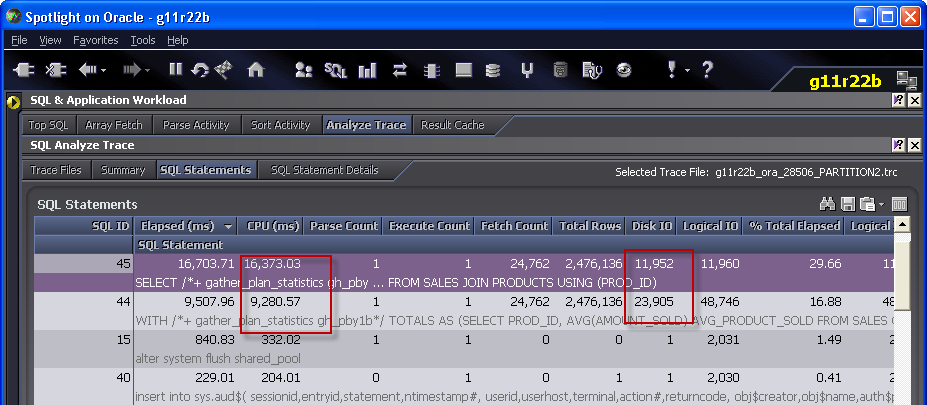
The IO for the PARTITION BY is now much less than for the GROUP BY, but the CPU for the PARTITION BY is still much higher. Even when there is lots of memory, PARTITION BY – and many analytical functions – are very CPU intensive. Here we see that even without the temporary segment IO, the WINDOW SORT is the most expensive operation:

I used to think that analytic functions – by avoiding duplicate table reads – offered a performance solution to certain problems. However the more I use them the more often I find that the CPU and memory cost of the analytic function is greater than the IO savings that it enables.
So.... the moral of the story: Analytic functions are very powerful and allow you to improve the clarity and simplicity of a lot of complex SQLs. And there are definitely some things that can only be done in SQL if you use an analytic function solution. However, they are resource intensive – most notably on memory, but also on CPU. In particular, make sure that you don’t inadvertently cause SQL performance to degrade when you move to an analytic function solution because you caused temporary segment IO.

Reader Comments