The parallel_degree_policy parameter in 11gR2
Oracle 11g release 2 introduced a number of significant tweaks to parallel SQL. One of the more significant is the new parameter PARALLEL_DEGREE_POLICY.
The PARALLEL_DEGREE_POLICY default setting of MANUAL results in Oracle 11g Release 1 behavior. However, a setting of AUTO results in the following new behaviors:
- The Degree of Parallelism (DOP) may be calculated based on the types of operations in the SQL statement and the sizes of the tables. The DOP for a sort of a massive table might be set higher than that of a small table, for instance.
- If the requested or required DOP is not possible because parallel servers are busy, then Oracle will defer statement execution rather than downgrading or serializing the SQL.
- Oracle parallel slaves may use buffered IO rather than direct IO: Oracle calls this (misleadingly I think) "in-memory parallel execution".
A setting of LIMITED fpr PARALLEL_DEGREE_POLICY enables automatic DOP only.
In this post I'm going to look at the last two changes: defered execution of Parallel SQL and buffered parallel IO.
Deferred execution
Prior to 11gR2, if there were insufficient parallel servers to satisfy the requested DOP, one of three things might occur:
- The SQL would be run at a reduced DOP (be downgraded)
- The SQL would run in serial mode (be serialized)
- If PARALLEL_MIN_PERCENT was specified and less than the nominated percentage of the DOP was achievable, then the the SQL statement might terminate with "ORA-12827: insufficient parallel query slaves available".
In 11gR2 if PARALLEL_DEGREE_POLICY is AUTO, then the default behavior is instead to block the SQL from executing until enough parallel slaves become available.
Here's some trace output for a parallel SQL that was repeatedly executed during a period in which parallel slaves were often busy and PARALLEL_DEGREE_POLICY=AUTO:
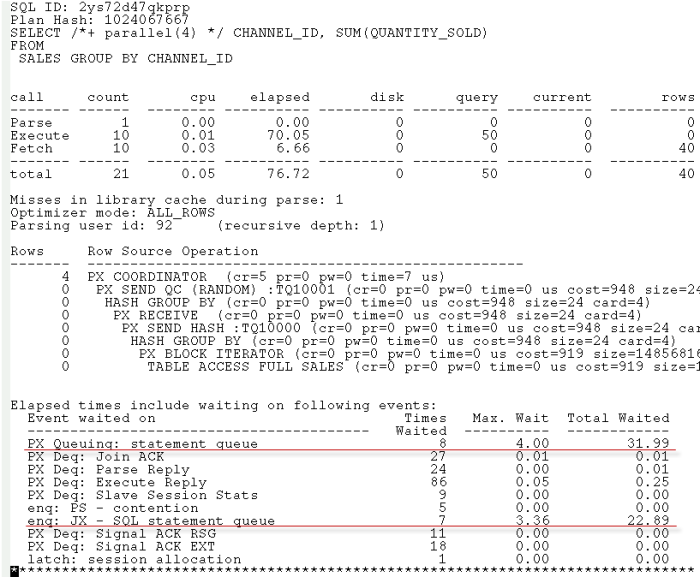
You can see that a big chunk of elapsed time is in two new wait categories:
- PX Queueing: statement queue is the amount of time spent waiting for an executing parallel SQL to relinquish it's PQ slaves. You can think of this as time spent at the "head" of the queue for parallel processing.
- enq: JX - SQL statement queue appears to be time spent waiting for some other statement to be queued for execution. The JX lock forms a queue for SQLs that are behind the "head" of the parallel execution queue.
The Oracle 11GR2 documentation is a bit misleading on this matter:
There are two wait events to help identity if a statement has been queued. A statement waiting on the event PX QUEUING: statement queue is the first statement in the statement queue. Once the necessary resource become available for this statement, it will be dequeued and will be executed. All other statements in the queue will be waiting on PX QUEUING: statement queue. Only when a statement gets to the head of the queue will the wait event switch to PX QUEUING: statement queue
I think that the above contains a typo - the first statement in the queue will wait on PX Queueing: statement queue and will hold the JX enqueue; subsequent statements will wait on enq: JX - SQL statement queue.
To test this, I submitted 3 jobs in succession each of which would tie up all the parallel servers. The first statement showed neither of the waits. The second statement showed waits on PX Queueing: statement queue but not on enq: JX - SQL statement queue. The third statement showed waits on both PX Queueing: statement queue and enq: JX - SQL statement queue. This is exactly what you'd expect if the JX enqueue creates a queue for a single PX Queueing wait.
So here's how the queue is implemented:
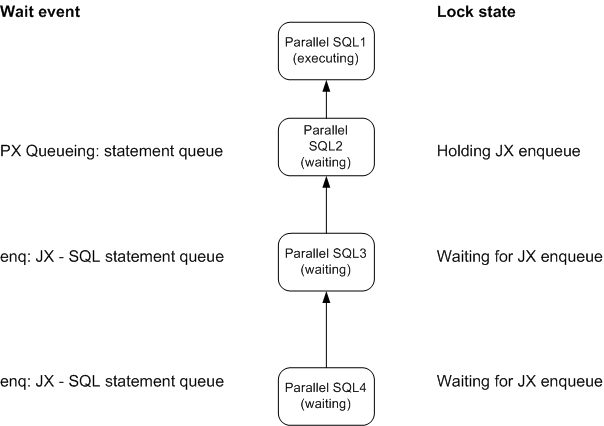
SQL 1 is executing, and tying up the parallel servers requried by SQL 2. SQL 2 is waiting for SQL 1 to complete and so is in the enq: JX - SQL statement queue wait: it holds the JX enqueue indicating that it is next in line to get the parallel servers. SQL 3 and SQL 4 want the JX enqueue held by SQL 2 and - as with all locks - are in a queue to obtain it.
In-memory Parallel Execution
Prior to 11g release 2, parallel queries would always use direct path reads to read table data. This made some sense, since otherwise buffer cache latch contention might be created within the parallel stream, and typical parallel query operations don't achieve much benefit from caching anyway (being heavily biased towards table scans).
However, sometimes direct path reads are far more expensive that buffer cache reads if the data happens to be cached. And with the massive buffer caches on 64 bit machines, it makes sense to let the parallel slaves read from the buffer cache unless the table is really massive.
If PARALLEL_DEGREE_POLICY is set to AUTO then Oracle might perform buffered IO instead of direct path IO. For instance here's the waits that result from executing a statement when PARALLEL_DEGREE_POLICY is set to MANUAL:
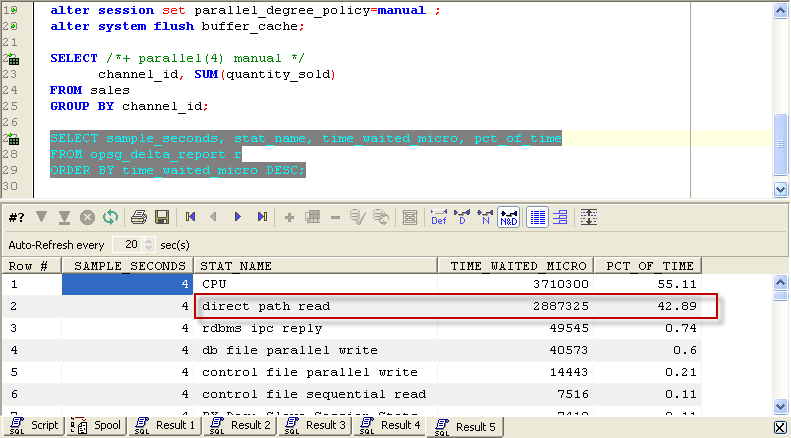
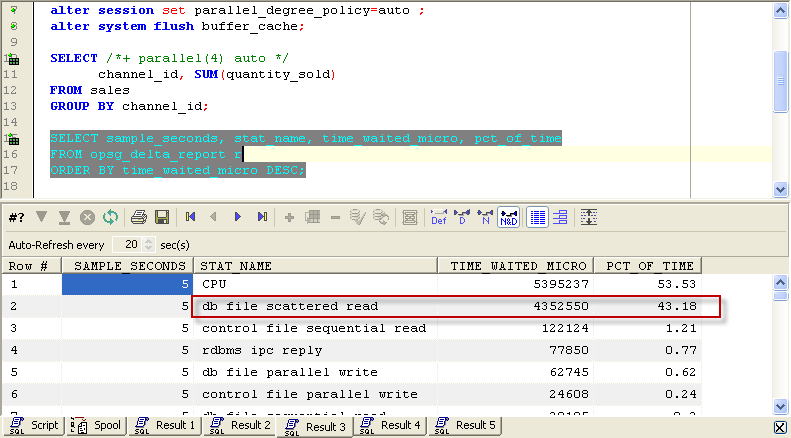
As we've come to expect, direct path reads are performed. If we set PARALLEL_DEGREE_POLICY to AUTO, then we see buffered IO:
The documentation says that the optimizer decides whether or not to use direct path depending on the size of the table and the buffer cache and the likelihood that some data might be in memory. I haven't tested that yet.
Other 11GR2 parallel goodies
There's a few other parameters added in 11GR2 of interest to those using parallel query:
- PARALLEL_DEGREE_LIMIT lets you cap the absolute DOP that any statement can request. By default it's 2xCPUs
- PARALLEL_FORCE_LOCAL allows you to restrict parallel execution to the current instance in a RAC cluster.
- PARALLEL_MIN_TIME_THRESHOLD restricts parallel exeuction to those SQLs that are estimated to have an execution time greater than the threshold value; by default 30 seconds.
 Guy Harrison
Reader Comments (5)
We had a situation with Oracle 10gR2, 4 node system. What attracted me to your posting was enq:JX message. Upon comparison with our scenario and what is described on your site, there was a close match.
* Lots of enq:JX messages, first message was PX queuing.
* There was a huge pile up with enq JX, mostly reported by scheduler.
* There were also buffer cache related waits (can not remember precise wait), there was a corresponding high number of waits.
We decided to make this policy manual from auto, everything is back to normal and no more waits. Excellent posting, thank you.
Nice write-up. Thanks!
Typo:
The picture shows a different wait for SQL 2... It seems that Oracle is not the only one having trouble keeping these events apart :-)
Contrary to the first comment, in our Solaris 10 Container, we have to change from the default manual to auto. A parallel query, which ran for hours under sqlplus, was able to finish in 30 seconds after using auto.
Thx Guy. Adroit article. Hope it sorts my OBIEE JX Locking issue.