Next Generation
Databases: NoSQL,
NewSQL and Big Data

Buy at Amazon
Buy at Apress

Search

Oracle Performance Survival Guide

Buy It
Read it on Safari
Scripts and Examples
Sample Chapter


 MySQL Stored procedure programming

Buy It
Read it on Safari
Scripts and Examples 


Entries in virtualization (3)

Monday
Jul122010

“Stolen” CPU on Xen-based virtual machines

I’ve written previously about how VMWare ESX manages CPU and how to measure your“real” CPU consumption if you are running an database in such a VM. 

VMware is currently the most popular virtualization platform for Oracle database virtualization, but Oracle’s own Oracle Virtual Machine uses the open source Xen hypervisor, as does Amazon’s Elastic Compute Cloud (EC2): which runs quite a few Oracle databases.    So Oracle databases – and many other interesting workloads – will often be found virtualized inside a Xen-based VM.

I recently discovered that there is an easy way to view CPU overhead inside a Xen VM, at least if you are running a paravirtulized linux kernel 2.6.11 or higher.   In this case, both vmstat and top support an “St” column, which describes the amount of time “stolen” from the virtual machine by Xen.  This stolen time appears to be exactly analogous to VMWare ESX ready time – it represents time that the VM was ready to run on a physical CPU, but that CPU was being allocated to other tasks – typically to another virtual machine. 

Here we see in top (on an Oracle Enterprise Linux on an EC2 instance) reporting that 13% of the CPU has been unavailable to the VM due to virtualization overhead.  Note that the graphical system monitor doesn’t reflect this – as far as it’s concerned CPU utilization has been at a steady 100%.

 12-07-2010 4-30-49 PM xenCPU

The great thing here is that you can view the overhead from within the virtual machine itself.  This is because in a paravirtualized Operating system – which are the norm in Xen based systems  - the kernel is rewritten to be virtualization aware.  The paravirtualized Linux kernel – from 2.6.11 – includes changes to vmstat and top to show the virtualization overhead.  In ESX you have to connect to the VSphere client or use one of the VMWare APIs to get this information. 

As with ESX, unless you know the virtualization overhead you can’t really interpret CPU utilization correctly.  For instance if your database is CPU bound and you get a sudden spike in response time, you need to know if that spike was caused by “stolen” CPU.  So you should keep track of the ESX ready statistic or the Xen “stolen” statistic whenever you run a database (or any critical  workload for that matter) in a VM.

We just introduced ESX support in the upcoming release of Spotlight on Oracle.  Starting with release 7.5 (which has just been made available with the latest release of Toad DBA suite) we show the virtualization overhead right next to CPU utilization and provide a drilldown giving you details of how the VM is serving your database:

7-07-2010 3-07-48 PM VMWare CPU contention 12-07-2010 4-30-49 PM Spotlight dd

We plan to add support for monitoring Xen-based virtualized databases in an upcoming release. 

Saturday
Apr102010

ESX CPU optimization for Oracle Databases

In the last post, I talked about managing memory for Oracle databases when running under ESX.  In this post I’ll cover the basics of CPU management.

ESX CPU Scheduling


Everyone probably understands that in a ESX server there are likely to be more virtual CPUs than physical CPUs.  For instance, you might have an 8 core ESX server with 16 virtual machines, each of which has a single virtual CPU.  Since there are twice as many virtual CPUs as physical CPUs, not all the virtual CPUs can be active at the same time.  If they all try to gain CPU simultaneously, then some of them will have to wait.

In essence, a virtual CPU (vCPU) can be in one of three states:

  • Associated with an ESX CPU but idle
  • Associated with an ESX CPU and executing instructions
  • Waiting for an ESX CPU to become available

As with memory,  ESX uses reservations, shares and limits to determine which virtual CPUs get to use the physical CPUs if the total virtual demand exceeds physical capacity.

  • Shares represent the relative amount of CPU allocated to a VM if there is competition.  The more shares the relatively larger number of CPU cycles will be allocated to the VM. All other things being equal, a VM with twice the number of shares will get access to twice as much CPU capacity.
  • The Reservation determines the minimum amount of CPU cycles allocated to the VM
  • The Limit determines the maximum amount of CPU that can be made available to the VM

VMs compete for CPU cycles between the limit and their reservation.  The outcome of the competition is determined by the relative number of shares allocated to each VM.

31-03-2010 12-09-38 PM cpu configuration 


Measuring CPU consumption in a virtual machine


Because ESX can vary the amount of CPU actually allocated to a VM, operating system reports of CPU consumption can be misleading.  On a physical machine with a single 2 GHz CPU, 50% utilization clearly means 1GHz of CPU consumed.  But on a VM, 50% might mean 50% of the reservation, the limit, or anything in between.  So interpreting CPU consumption requires the ESX perspective as to how much CPU was actually provided to the VM.

The Performance monitor in the vSphere client gives us the traditional measures of CPU consumption:  CPU used, CPU idle, etc.  However it adds the critical “CPU Ready” statistic.  This statistic reflects the amount of time the VM wanted to consume CPU, but was waiting for a physical CPU to become available.  It is the most significant measure of contention between VMs for CPU power.

For instance in the chart below, we can see at times that the amount of ready time is sometimes almost as great as the amount of CPU actually consumed.  In fact you can probably see that as the ready time goes up, the VMs actual CPU used goes down – the VM wants to do more computation, but is unable to do so due to competition with other VMs.

31-03-2010 12-28-49 PM CPU Ready

The display of milliseconds in each mode makes it hard to work out exactly what is going on.  In the next release of Spotlight on Oracle (part of the Toad DBA suite) we’ll be showing the amount of ready time as a proportion of the maximum possible CPU, and provide drilldowns that show CPU limits, reservations, utilization and ready time. 


Co-scheduling


For a VM with multiple virtual CPUs, ESX needs to synchronize vCPUs cycles with physical CPU consumption.   Significant disparities between the amounts of CPU given to each vCPU in a multi-CPU VM will cause significant performance issues and maybe even instability.    A “strict co-scheduling policy” is one in which all the vCPUs are allocated to the physical CPUs simultaneously, or at least when any one CPU falls significantly behind in processing.   Modern ESX uses “relaxed co-scheduling” in which only CPUs that have fallen behind need to be scheduled.

In practice however,  on a multi-CPU system all the CPUs generally consume roughly equivalent amounts of CPU and most of the time all of them will need to be scheduled together.  This can make it harder for ESX to allocate CPUs.   For instance, in the diagram below we see how the more vCPUs are configured, the fewer scheduling choices are available to the ESX scheduler:


29-03-2010 4-38-05 PM CPU Sockets

(Thanks to Carl Bradshaw for letting me reprint that diagram from his Oracle on VMWare whitepaper)

As a result,  you can actually find performance decreasing as the number of cores increases.  This will be most apparent if you try and configure as many vCPUs as physical CPUs. 

Even if there is no competition from other virtual machines, the ESX hypervisor itself will require CPU resources and find it difficult to schedule all the cores of the VM.  This is very noticeable on VMware workstation:  if you create a two-CPU virtual machine on a dual core laptop, it will almost certainly perform worse than a single CPU VM, because VMware will have trouble scheduling both the vCPUs simultaneously.

In general, don’t allocate a lot of vCPUs unless you are sure that the ESX server is usually under light load from other VMs and that your database actually needs the extra cores.

Summary


Effective ESX memory configuration requires co-ordination between Oracle’s memory management and the ESX memory management to avoid PGA or SGA ending up on disk.  CPU is a lot simpler.  In general I recommend the following:

  • Avoid over-allocating CPU cores:  don’t automatically assume that more CPUs will lead to better performance
  • Use reservations, limits and shares to determine the relative amount of CPU that will be allocated to your VM
  • Monitor the ESX “CPU ready” statistic to determine how competition with other VMs is affecting your virtualized databases’ access to CPU.
Tuesday
Feb232010

Memory Management for Oracle databases on VMWare ESX

The trend towards virtualization of mid-level computing workloads is progressing rapidly.  The economic advantages of server consolidation and the – often exaggerated – reduction in administration overheads seem pretty compelling.  And virtualized servers are quicker to provision and offer significant advantages in terms of backup, duplication and migration.

The virtualization of Oracle databases has proceeded more slowly, due to concerns about performance, scalability and support.  Oracle corporation has given mixed messages about support for virtualized databases,  though they currently appear to have conceded that Oracle databases on VMWare are supported, at least for single instance databases (see ).

Oracle would prefer that we use their Xen-based virtualization platform, but they face an uphill battle to persuade the data centers to move from ESX, which is established as a defacto platform in most sites.

So like it or not, we are probably going to see more databases running on ESX and we’d better understand how to manage ESX virtualized databases.  In this post, I’m going to discuss the issues surrounding memory management in ESX.

Configuring memory


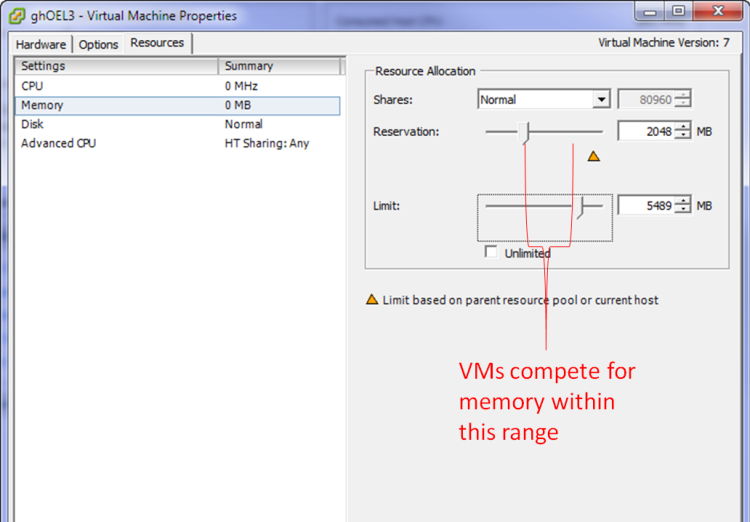
When creating a VM in ESX we most significantly configure the amount of “physical” memory provided to the VM.  If there is abundant memory on the ESX server then that physical memory setting will be provided directly out of ESX physical memory.  However, in almost all ESX servers the sum of virtual memory exceeds the physical ESX memory and so the VM memory configuration cannot be met.  The Resources tab options control how VMs will compete for memory.

The key options are:

  • Shares.  These represent the relative amount of memory allocated to a VM if there is competition.  The more shares the relatively larger the memory allocation to the VM. All other things being equal, a VM with twice the number of shares will get twice the memory allocation.  However, ESX will “tax” memory shares if the VM has a large amount of idle memory. 
  • Reservation:  This is the minimum amount of physical memory to be allocated to the VM.  If there is insufficient memory to honor the reservation then the VM will not start. 
  • Limit:  This is the maximum amount of memory that the VM will use.   The advantage of using limit rather than simply reconfiguring the VM memory is that you don’t need to reboot the VM to adjust the memory limit.

So in general, an ESX VM will have a physical memory allocation between the reservation and the limit.  In the event that VMs are competing for memory, the shares setting will determine who gets the most memory.


Ballooning and Swapping


When ESX wants to adjust the amount of physical memory allocated to the VM, it has two options:

  • If VMWare tools are installed, ESX can use the vmmemctl driver (AKA the “balloon” driver) which will force the VM to swap out physical memory to the VMs own swapfile.
  • If VMWare tools are not installed, then ESX can directly swap memory out to it’s own swapfile.   This swapping is “invisible” inside the VM.

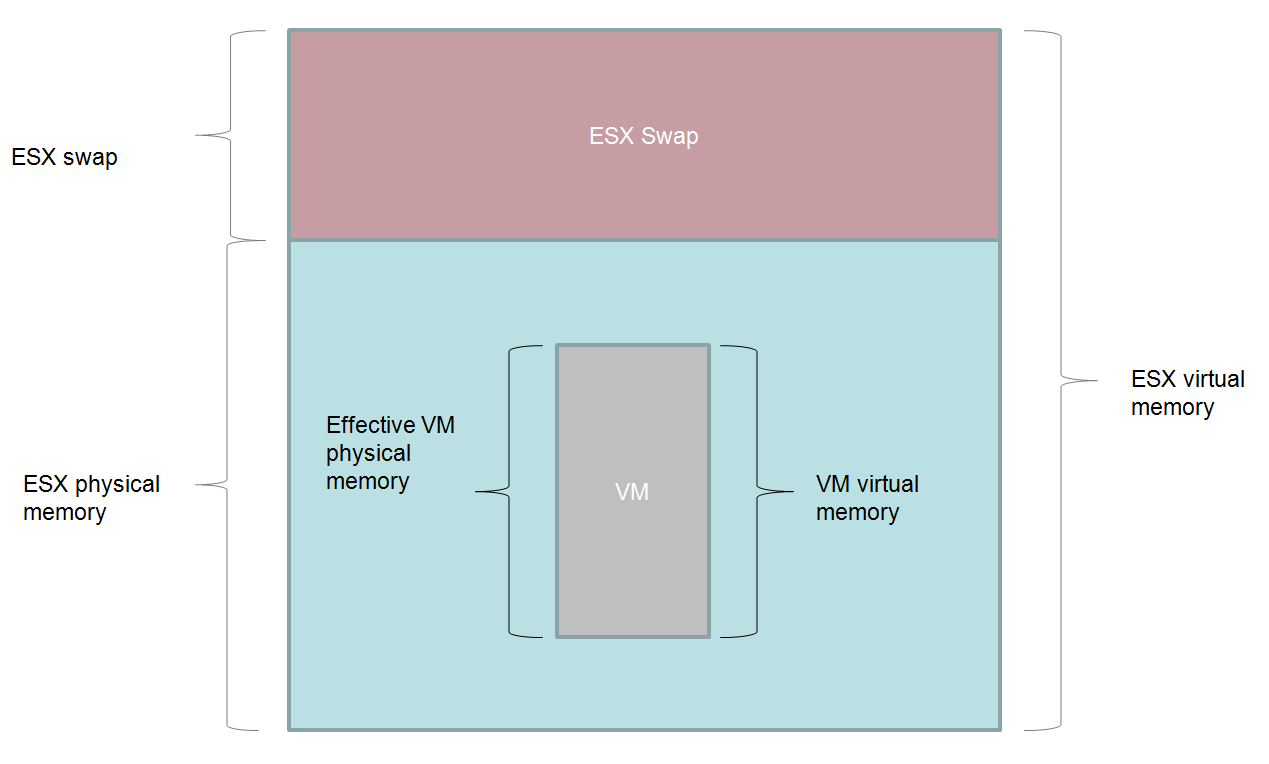
Let’s look at these two mechanisms.  Let’s start with a VM which has all it’s memory mapped to ESX physical memory as in the diagram below:


Life is good – VM physical memory is in ESX physical memory, which is generally what we want. 

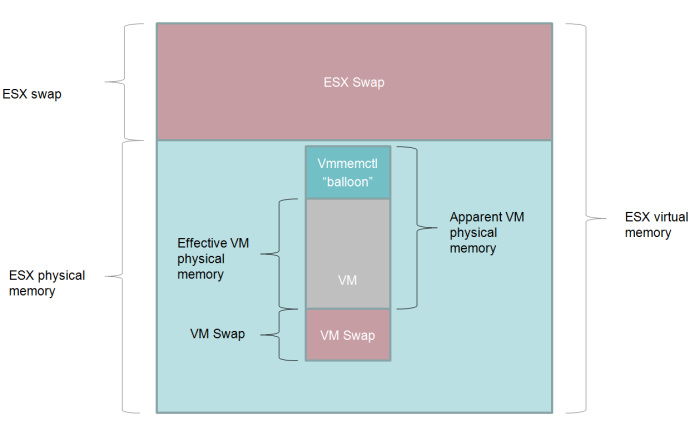
If there is pressure on ESX memory and ESX decides that it wants to reduce the amount of physical memory used by the VM – and VMWare tools is installed – then it will use the vmmemctl driver.  This driver is also refered to as the “balloon” driver – you can think of it expanding a balloon within VM memory pushing other memory out to disk. This driver will – from the VMs point of view – allocate enough memory within the VM to force the VM Operating System to swap out existing physical memory to the swapfile.   Although the VM still thinks the vmmemctl allocations are part of it’s physical memory address space, in reality memory allocated by the balloon is available to other VMs:


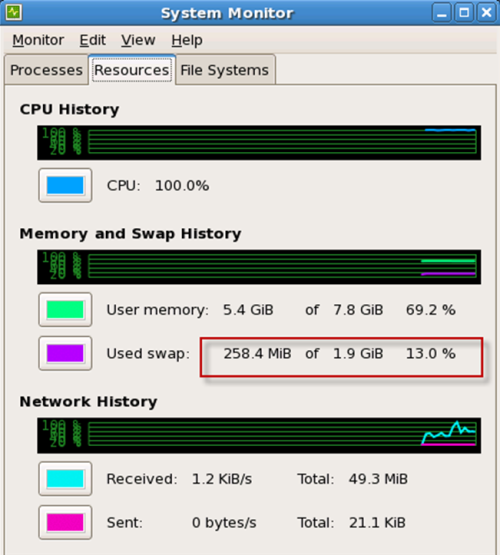
Inside the VM, we can see that memory is swapped out by using any of the standard system monitors:


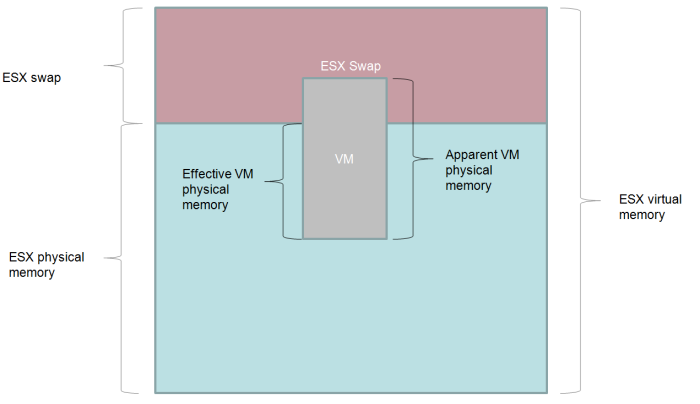
If VMware tools are not installed, then ESX will need to swap out VM memory to it’s own swap file.  Inside the VM it looks like all of the memory is still allocated, but in reality some of the memory is actually in the ESX swap file.


Monitoring memory


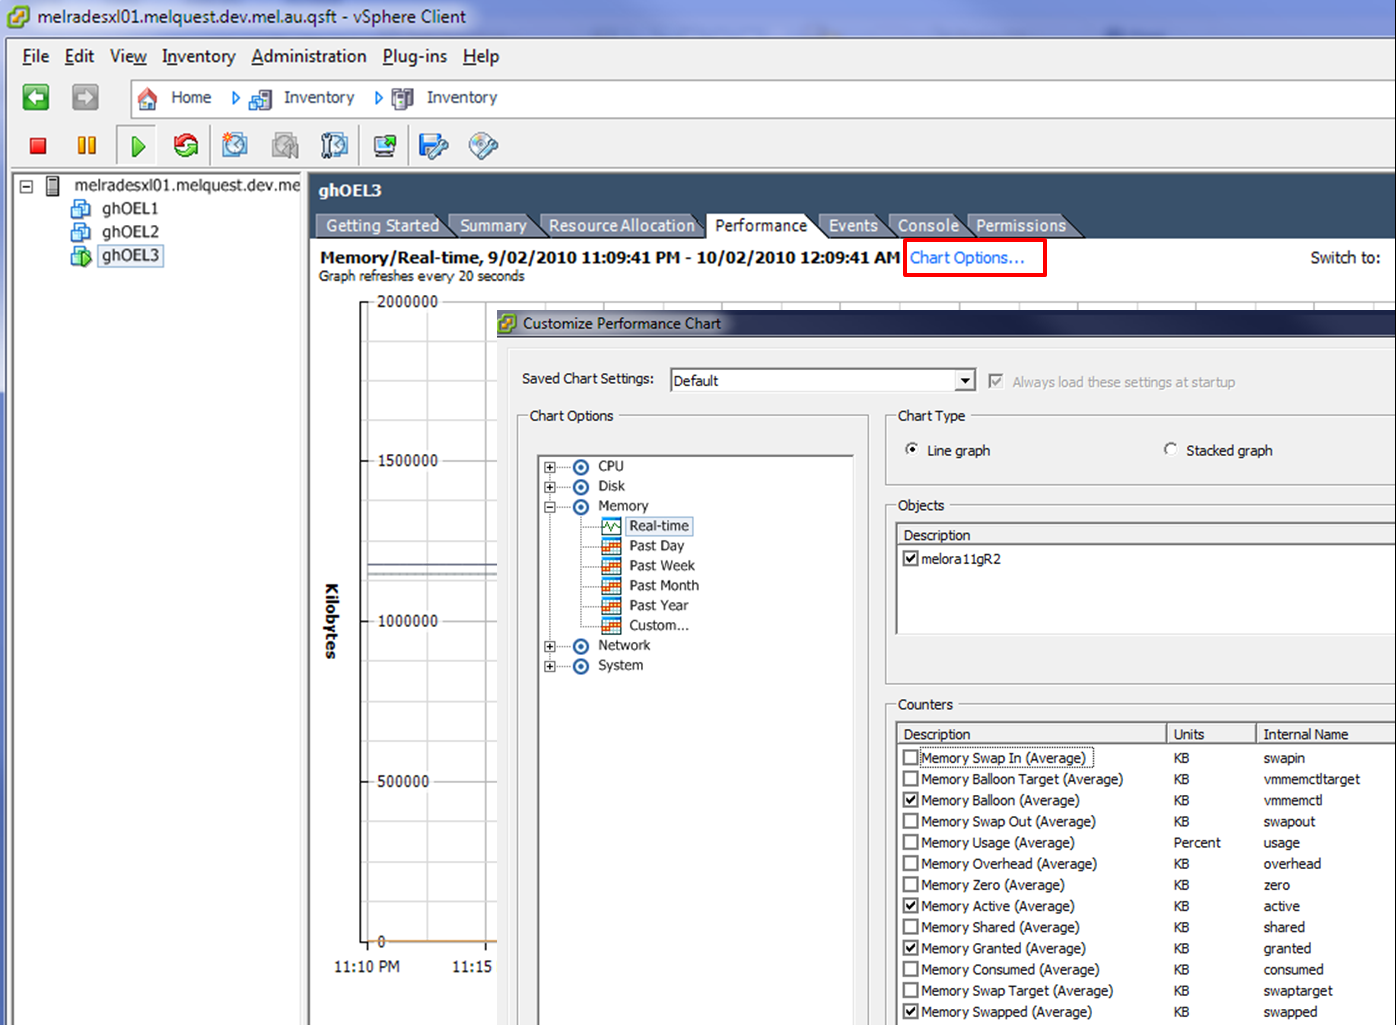
We can see what’s going on in the ESX server by using the Performance monitoring chart.  Personally, I like to customize the chart to show just active memory, granted memory, balloon size and swap size as shown below:


Recommendations for Oracle databases


Hopefully we now have some idea how Oracle manages ESX memory and how the physical memory in the VM can be reduced.

Its true that for some types of servers – a mail or file server for instance – having physical memory removed from the VM might be appropriate and cause only minor performance issues.  However, for an Oracle database, any reduction in the physical memory of the VM is probably going to result in either SGA or PGA memory being placed on disk.  We probably never want that to happen.

Therefore, here are what I believe are the ESX memory best practices for Oracle databases:

  • Use memory reservations to avoid swapping.  There’s no scenario I can think of in which you want PGA and SGA to end up on disk, so you should therefore set the memory reservation to prevent that from happening.  
  • Install VMware tools to avoid “invisible” swapping.  If VM memory ends up on disk you want to know about it within the VM.  The vmmemctl “balloon” driver allows this to occur.  Furthermore, the OS in the VM probably has a better idea of what memory should be on disk that ESX.  Also, if you use the vmmemctl driver then you can use the LOCK_SGA parameter to prevent the SGA from paging to disk.    
  • Adjust your Oracle targets and ESX memory reservation together.  For instance, if you adjust MEMORY_TARGET in an 11g database, adjust the ESX memory reservation to match.  Ideally,  the ESX memory reservation should be equal to MEMORY_TARGET plus some additional memory for the OS kernel, OS processes and so on.   You’d probably want  between 200-500MB for this purpose.
  • Don’t be greedy.  With physical servers we are motivated to use all the memory we are given.  But in a VM environment we should only use the memory we need so that other VMs can get a fair share.  Oracle advisories – V$MEMORY_TARGET_ADVICE, V$SGA_TARGET_ADVICE, V$PGA_TARGET_ADVICE – can give you an idea of how performance would change if you reduced – or increased – memory.  If these advisories suggest that you can reduce memory without impacting performance then you may wish to do so to make room for other VMs. 

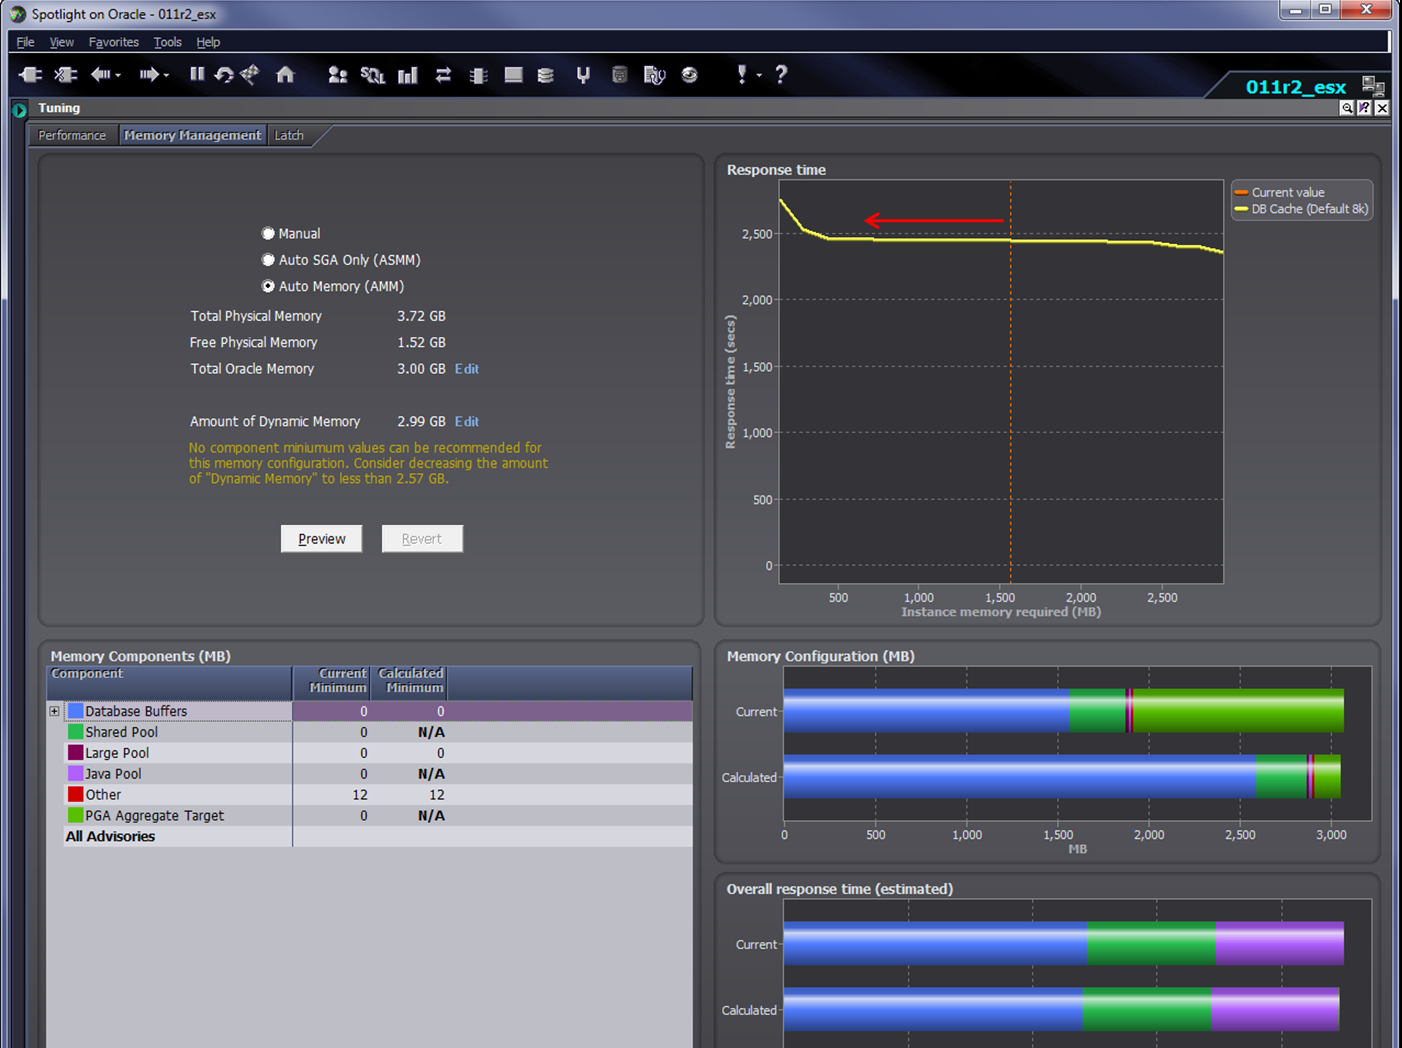
In the next release of Spotlight on Oracle, we will be monitoring ESX swapping and ballooning and raising alarms if it looks like ESX is pushing PGA or SGA out to disk.  Spotlight also has a pretty good – if I do say so myself – memory management module that can be used to adjust the database memory to an optimal level (see below).  In a future release I hope to enhance that capability to allow you to adjust database and ESX reservations in a single operation.