Histograms of histograms
One of our TOAD customers asked us if we could show a chart of CBO histogram values so that they could observe the skew in column values. We don't currently, but will in an upcoming version of SQL Optimizer (part of TOAD DBA and Developer suites). In the meantime, the idea of have an SQL that generated a histogram (as bar charts are sometimes called) of a histogram seemed appealing, so here's some SQL to do that.
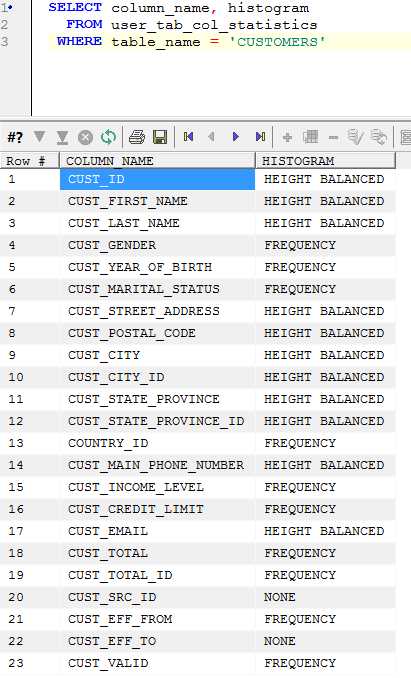
In case you don't know, Oracle uses height balanced histograms when the number of distinct values is high. In a height balanced histogram the number of rows in each bucket is about the same, but the range of values in each bucket varies. However, when the number of buckets in the histogram is greater than or equal to the number of distinct column values then Oracle will create a frequency histogram. In a frequency histogram each bucket represents a value, and the number of rows matching the value is recorded. The Oracle documentation set describes the two types of histograms here.
This script will create a bar chart (AKA a histogram) as for a frequency histogram. For instance, here is a display of the values for the CUST_DATE_OF_BIRTH column in the CUSTOMERS table:
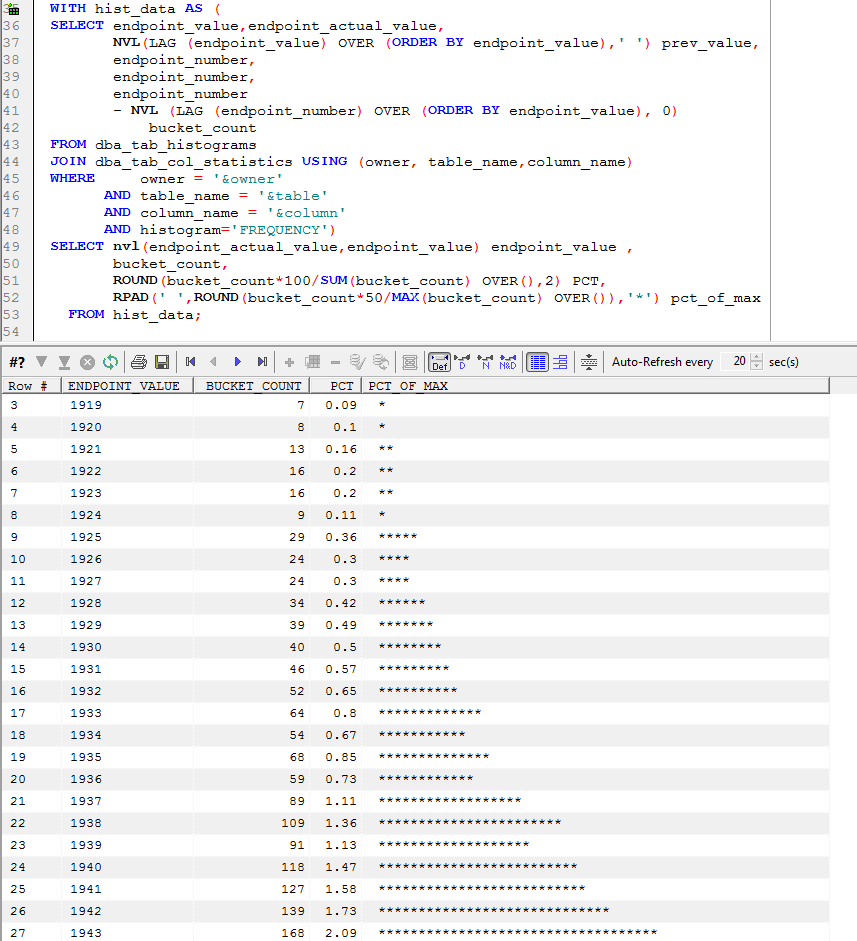
The script uses the ENDPOINT_ACTUAL_VALUE column if present, otherwise the ENDPOINT_VALUE column. For numeric columns, ENDPOINT_VALUE is fine, but for character columns it's meaningless.
Unfortunately ENDPOINT_ACTUAL_VALUE is not generally populated. According to Jonathan Lewis in Cost Based Oracle Fundamentals, from 9i onwards: "Oracle only populates the endpoint_actual_value column of the histogram views if there is at least one pair of values that, roughly speaking, are identical for the first six characters".
So for most character columns, the script will report something unhelpful like this (this is the CUSTOMERS.CUST_INCOME_LEVEL column):
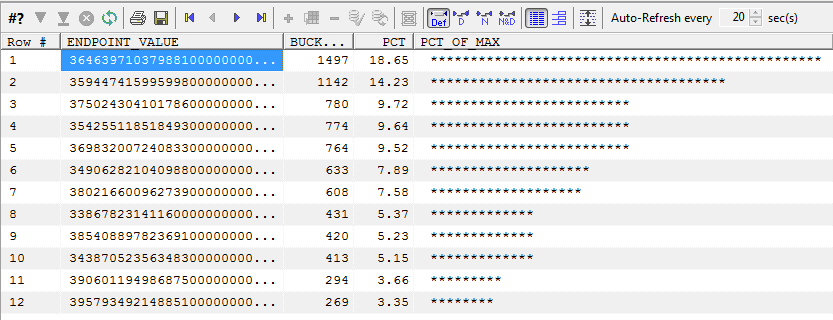
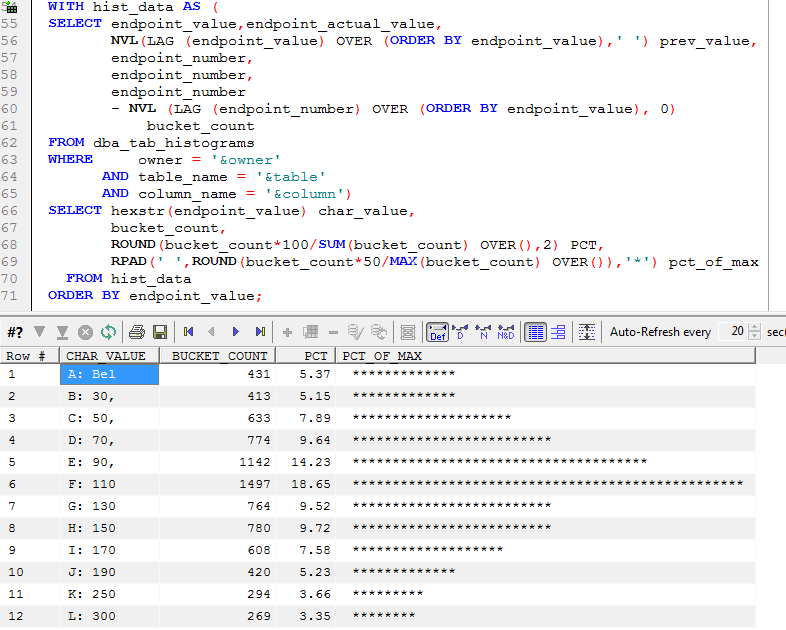
Tom Kyte provided a PL/SQL function "hexstr" that can decode the ENPOINT_VALUE to a character string - at least for the first 6 bytes. So using Tom's function, we can get a better sense of the distribution of CUST_INCOME_LEVEL:
 Guy Harrison
Reader Comments