Next Generation
Databases: NoSQL,
NewSQL and Big Data

Buy at Amazon
Buy at Apress

Search

Oracle Performance Survival Guide

Buy It
Read it on Safari
Scripts and Examples
Sample Chapter


 MySQL Stored procedure programming

Buy It
Read it on Safari
Scripts and Examples 


Monday
Oct052009

Oracle Performance Survival Guide available as PDF

My new book Oracle Performance Survival Guide just became available for PDF download at Informit.com!

The print version is available for pre-order at Informit or Amazon and elsewhere, and is due in book stores on October 14th.  There will be copies available at the Oracle Open World book store next week however and we'll be having a book signing with giveaways at the Quest Software booth, probably on Wednesday.   I haven't seen a print copy myself yet, but I was probably the first to buy a digital copy :-).   It will also soon be available on Kindle and on the Safari on-line bookshelf. 

This is the most challenging book I've written, and the most extensive in terms of scope.  I tried to write a book that would be accessible across a broad range of expertise, and which would systematically address most major aspects of Oracle RDBMS performance tuning.   Overall, I'm satisfied that it's a worthwhile contribution to Oracle performance literature.   

You can see the full table of contents at the books Informit webpage, but here's the short chapter list to give you an idea:  


PART I: METHODS, CONCEPTS, AND TOOLS
1 Oracle Performance Tuning: A Methodical Approach
2 Oracle Architecture and Concepts  
3 Tools of the Trade

PART II: APPLICATION AND DATABASE DESIGN
4 Logical and Physical Database Design
5 Indexing and Clustering
6 Application Design and Implementation

PART III: SQL AND PL/SQL TUNING
7 Optimizing the Optimizer
8 Execution Plan Management
9 Tuning Table Access
10 Joins and Subqueries
11 Sorting, Grouping, and Set Operations
12 Using and Tuning PL/SQL
13 Parallel SQL
14 DML Tuning

PART IV: MINIMIZING CONTENTION
15 Lock Contention  
16 Latch and Mutex Contention  
17 Shared Memory Contention

PART V: OPTIMIZING MEMORY
18 Buffer Cache Tuning  
19 Optimizing PGA Memory
20 Other Memory Management Topics

PART VI: IO TUNING AND CLUSTERING
21 Disk IO Tuning Fundamentals
22 Advanced IO Techniques
23 Optimizing RAC

Scripts, examples and packages are available for download here

Saturday
Sep192009

MTS + AMM + BULK COLLECT = Trouble!

Most databases don't run with shared servers - A.K.A. Multi-Threaded Servers or MTS - nowadays.   While reducing the number of server processes can reduce overall memory demand and sometimes certain forms of contention, the drawbacks - particularly delays caused when all serves are busy - are generally regarded as greater than the advantages. 

MTS becomes downright dangerous when Automatic Shared Memory Management (ASMM) or Automatic Memory Management (AMM) is in place.  When you use MTS and AMM (or ASMM) together, PL/SQL programs that try to create large collections can effectively consume all available server memory with disastrous consequences. 

When you allocate PL/SQL program memory with dedicated servers, the memory comes out of the PGA.  If you exceed your fair share of PGA allocation, you'll receive an ORA-4030 error:


BULK COLLECT for large tables is generally not a good idea because of the memory required;  it's far better to bulk fetch in increments using the LIMIT keyword, as in this snippet:

In fact, it's not necessary to explicitly code the LOOP with LIMIT from 10g onwards providing that PLSQL_OPTIMIZE_LEVEL is set to the default of 2 or higher.  With PLSQL_OPTIMIZE_LEVEL>=2, the PL/SQL compiler will transparently rewrite simple loops to use bulk collect with a LIMIT clause of 100.  For instance the statement below will have exactly the same performance profile as the statement above:


As counter-productive as a BULK COLLECT without LIMIT is in any circumstances, it becomes actively dangerous when using MTS and either Automatic Shared Memory Management (ASMM) or 11g Automatic Memory Management (AMM). 

When using dedicated servers, memory for PL/SQL variables is allocated from the Program Global Area (PGA).  However, with MTS the memory is allocated from the large pool.  If you try to allocate a very large collection when connected via MTS - and AMM or ASMM is enabled - then Oracle will expand the size of the large pool to make room for your collection.  

Here's what happens when we run the first BULK COLLECT example when using MTS and AMM (image courtesy of Spotlight on Oracle):

 That's right: AMM allocates virtually all memory on the system to the large pool in order to accommodate the PL/SQL memory request.  First it consumes the buffer cache, then it reduces the PGA_AGGREGATE_TARGET - all the way to zero!  Sessions that may have been doing buffered IO or large sorts may experience severe degradation as in-memory sorts go to disk, and buffered IOs fail to find anything in the buffer cache.  

If you have a diagnostic pack license, you can see the same thing in OEM in the Memory advisors page:

Conclusion

  1. Don't use MTS unless you have a very good reason.  Not only does it have it's own issues, but it works poorly with Automatic memory management (AMM or ASMM).
  2. Don't use SELECT ... BULK COLLECT INTO unless the table is very small.  An explicit cursor with a LIMIT clause is preferable, and if PLSQL_OPTIMIZE_LEVEL is set to defaults, you often don't need to worry too much about bulk collect at all, since it is automatically implemented (with an array size of 100) by the PLSQL compiler
  3. When using AMM or ASMM beware of one memory region "starving" another.  The best way to avoid this is to set minimum values for specific memory areas.  For instance, you could avoid the phenomenon above if you set a value for PGA_AGGREGATE_TARGET and DB_CACHE_SIZE.  When AMM is in effect, these values will serve as minimum values which will avoid either area shrinking to absurdly small values.  We have a wizard in Spotlight on Oracle that can help you set these minimum values. 


Monday
Sep142009

More on the parallel execution queue


In the last post, I looked at how the 11GR2 parallel execution queue worked.  Essentially the holder of the JX enqueue is the next in line for parallel execution and others in the queue are waiting on the JX enqueue.  

I thought it would be useful to write an SQL to list the PQO statements running, and those waiting.  The script is here:  it joins V$SESSION, V$WAIT_CHAINS, V$PX_SESSION and V$SQL to show execution parallel SQLs and the SQLs holding or waiting on the JX enqueue. 

Here's some sample output:


The NO_STATEMENT_QUEUING hint

There's a new hint - NO_STATEMENT_QUEUING - that will prevent a SQL from being queued regardless of the setting of PARALLEL_DEGREE_POLICY.  If the NO_STATEMENT_QUEUING hint is included in the SQL, and there are insufficient parallel query processes to run at the requested Degree of Parallelism, then the SQL will be downgraded, serialized or fail with an error, depending on the settings for PARALLEL_MIN_PERCENT.   It will not, of course, be queued for later execution using the JX enqueue mechanism. 

The inverse hint - STATEMENT_QUEUING - causes statements to be queued even if the setting for PARALLEL_DEGREE_POLICY is LIMITED or MANUAL. 

Tuesday
Sep082009

The parallel_degree_policy parameter in 11gR2

Oracle 11g release 2 introduced a number of significant tweaks to parallel SQL.  One of the more significant is the new parameter PARALLEL_DEGREE_POLICY.  

The PARALLEL_DEGREE_POLICY default setting of MANUAL  results in  Oracle 11g Release 1 behavior.  However, a setting of AUTO results in the following new behaviors:


  • The Degree of Parallelism (DOP) may be calculated based on the types of operations in the SQL statement and the sizes of the tables.  The DOP for a sort of a massive table might be set higher than that of a small table, for instance. 
  • If the requested or required DOP is not possible because parallel servers are busy, then Oracle will defer statement execution rather than downgrading or serializing the SQL. 
  • Oracle parallel slaves may use buffered IO rather than direct IO:  Oracle calls this (misleadingly I think) "in-memory parallel execution". 

A setting of LIMITED fpr PARALLEL_DEGREE_POLICY enables automatic DOP only. 

In this post I'm going to look at the last two changes:  defered execution of Parallel SQL and buffered parallel IO. 

Deferred execution

Prior to 11gR2, if there were insufficient parallel servers to satisfy the requested DOP, one of three things might occur:


  1. The SQL would be run at a reduced DOP (be downgraded)
  2. The SQL would run in serial mode (be serialized)
  3. If PARALLEL_MIN_PERCENT was specified and less than the nominated percentage of the DOP was achievable, then the the SQL statement might terminate with "ORA-12827: insufficient parallel query slaves available".


In 11gR2 if PARALLEL_DEGREE_POLICY is AUTO, then the default behavior is instead to block the SQL from executing until enough parallel slaves become available.  

Here's some trace output for a  parallel SQL that was repeatedly executed during a period in which parallel slaves were often busy and PARALLEL_DEGREE_POLICY=AUTO:


You can see that a big chunk of elapsed time is in two new wait categories:

  • PX Queueing: statement queue is the amount of time spent waiting for an executing parallel SQL to relinquish it's PQ slaves.  You can think of this as time spent at the "head" of the queue for parallel processing.  
  • enq: JX - SQL statement queue appears to be time spent waiting for some other statement to be queued for execution.  The JX lock forms a queue for SQLs that are behind the "head" of the parallel execution queue.


The Oracle 11GR2 documentation is a bit misleading on this matter:

There are two wait events to help identity if a statement has been queued. A statement waiting on the event PX QUEUING: statement queue is the first statement in the statement queue. Once the necessary resource become available for this statement, it will be dequeued and will be executed. All other statements in the queue will be waiting on PX QUEUING: statement queue. Only when a statement gets to the head of the queue will the wait event switch to PX QUEUING: statement queue 


I think that the above contains a typo - the first statement in the queue will wait on PX Queueing: statement queue and will hold the JX enqueue;  subsequent statements will wait on enq: JX - SQL statement queue.  

To test this, I submitted 3 jobs in succession each of which would tie up all the parallel servers.  The first statement showed neither of the waits.  The second statement showed waits on PX Queueing: statement queue but not on enq: JX - SQL statement queue.  The third statement showed waits on both PX Queueing: statement queue and enq: JX - SQL statement queue.   This is exactly what you'd expect if the JX enqueue creates a queue for a single PX Queueing wait. 

So here's how the queue is implemented:

SQL 1 is executing, and tying up the parallel servers requried by SQL 2.  SQL 2 is waiting for SQL 1 to complete and so  is in the enq: JX - SQL statement queue wait:  it holds the JX enqueue indicating that it is next in line to get the parallel servers.  SQL 3 and SQL 4 want the JX enqueue held by SQL 2 and - as with all locks - are in a queue to obtain it. 


In-memory Parallel Execution

Prior to 11g release 2, parallel queries would always use direct path reads to read table data.  This made some sense, since otherwise buffer cache latch contention might be created within the parallel stream, and typical parallel query operations don't achieve much benefit from caching anyway (being heavily biased towards table scans). 

However, sometimes direct path reads are far more expensive that buffer cache reads if the data happens to be cached.  And with the massive buffer caches on 64 bit machines, it makes sense to let the parallel slaves read from the buffer cache unless the table is really massive. 

If PARALLEL_DEGREE_POLICY is set to AUTO then Oracle might perform buffered IO instead of direct path IO.  For instance here's the waits that result from executing a statement when PARALLEL_DEGREE_POLICY is set to MANUAL:


As we've come to expect, direct path reads are performed.  If we set PARALLEL_DEGREE_POLICY to AUTO, then we see buffered IO:

The documentation says that the optimizer decides whether or not to use direct path depending on the size of the table and the buffer cache and the likelihood that some data might be in memory.  I haven't tested that yet. 

Other 11GR2 parallel goodies


There's a few other parameters added in 11GR2 of interest to those using parallel query:  


  • PARALLEL_DEGREE_LIMIT lets you cap the absolute DOP that any statement can request.  By default it's 2xCPUs
  • PARALLEL_FORCE_LOCAL allows you to restrict parallel execution to the current instance in a RAC cluster.
  • PARALLEL_MIN_TIME_THRESHOLD restricts parallel exeuction to those SQLs that are estimated to have an execution time greater than the threshold value; by default 30 seconds.   


Thursday
Sep032009

Columnar compression in 11gR2

Important note:  I wrote this post based on research with the 11gR2 beta.  After posting it I discovered that the implementation of columnar compression was restricted in the production release.  See the end of the post for important errata (and apologies). 

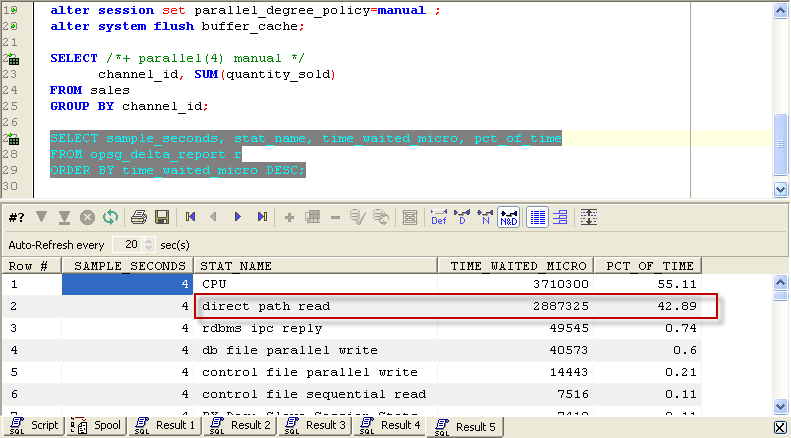
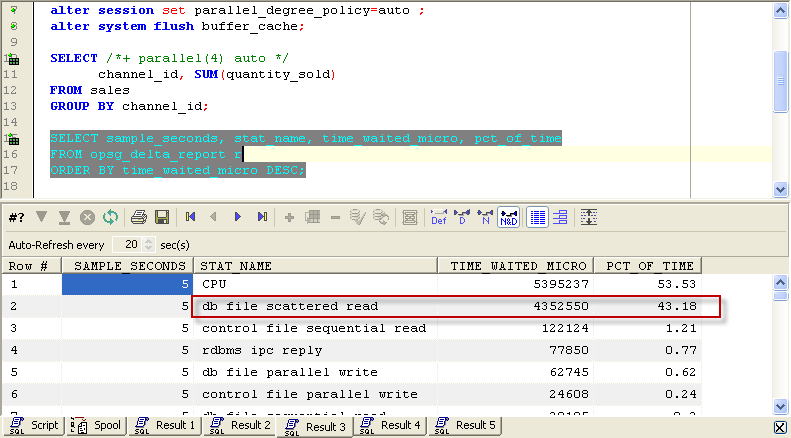
We often think of compression as being a trade off between performance and storage:  compression reduces the amount of storage required, but the overhead of compressing and decompressing makes things slower.  However, while there is always some CPU overhead involved in compression the effect on table scan IO can be favourable, since if a table is reduced in size it will require fewer IO operations to read it. 

Prior to 11g, table compression could only be achieved when the table was created, rebuilt or when using direct load operations.  However, in 11g, the Advanced Compression option allows data to be compressed when manipulated by standard DML.   Compression becomes even more attractive in 11gR2 because we can use columnar compression to get much higher compression levels than were previously possible. 

Column-oriented databases and columnar compression


One of the key advantages of columnar databases such as Vertica is that they can get much higher compression ratios than are normally possible for traditional row-oriented databases.

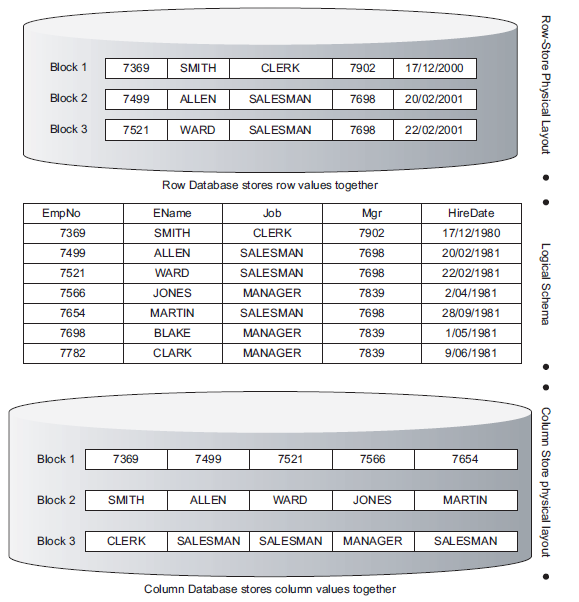
The traditional RDBMS implementation – including Oracle – is to store all data for a given row in the same block.  This might be  might be optimal for OLTP operations – create an entry, query an entry, change an entry – but is not optimal for many data warehousing and BI query scenarios.  In these scenarios storing the data for a specific column in the same block is far more effective, since data warehousing queries usually aggregate within columns and across rows.

Mike Stonebraker – pioneer of relational databases and one of the creators of Postgress – and his team proposed a new model for column-centric databases called C-Store in 2005.   C-Store is a SQL-based database which uses a column-oriented architecture to optimize data warehousing activities.  I wrote about C-Store and other next-generation database proposals in this DBTA article

One of the big advantages of column-oriented databases is that very high compression rates can be achieved.  Compression works best when repeated patterns are present.  The repetition within columns is almost always far greater than the repetition within rows.  For instance a SURNAME column can be expected to have many repeated entries, whereas there will be little or no repetition between a SURNAME and a DATE_OF_BIRTH column.   Column orientation therefore allows for very high compression ratios to be achieved with only modest CPU requirements.


Column Database (C-store, Vertica) architecture

The big problem with column-oriented database is that DML is very expensive.  A single row insert  must update all of the blocks containing the columns for that row.  In a columnar database, that multiples the write overhead dramatically.

Columnar compression in Oracle 11GR2


In 11g Release 2, Oracle has provided a compromise by introducing a form of columnar compression that works on top of normal row-oriented Oracle tables.   Standard Oracle compression compresses the contents of a table row by row.   This means that compression ratios will be higher if there is repeated data within a row.  However, 11GR2  columnar compression compresses data on a column by column basis.  This achieves much higher compression ratios, because there is likely to be more repeated data within a column than within a row.   The drawback for columnar compression is that it takes a lot longer to create new data, since for each row inserted Oracle has to read all or some of the corresponding data values in other rows to see what data exists in other columns. 

You can implement  11g R2 columnar compression using the “COMPRESS FOR ARCHIVE LEVEL=compression_level” syntax in the CREATE TABLE statement.   Compression_level may take a value of 1,2 or 3.   For instance I could create a compressed copy of the SALES table with the following statement:

CREATE TABLE sales_c
   COMPRESS FOR ARCHIVE LEVEL=AS
     SELECT *
       FROM sh.sales s;


The higher the value of LEVEL, the better the compression but the higher the compression cost.  DML times increase dramatically as you increase the LEVEL, but table scans times decrease.   High values should generally be used for tables which are infrequently updated or where the speed of the update is not important. 

The chart below illustrates the cost-benefit ratios for the various levels of compression.   Higher levels of compression result in smaller segments which will be quicker to scan.  However, the time taken to load the tables at the higher levels of compression are much greater.  The appropriate level for your table will depend both on the usage patterns and the type of data – character data will compress better leading to more benefit.  OLTP data will be updated more frequently leading to more overhead.

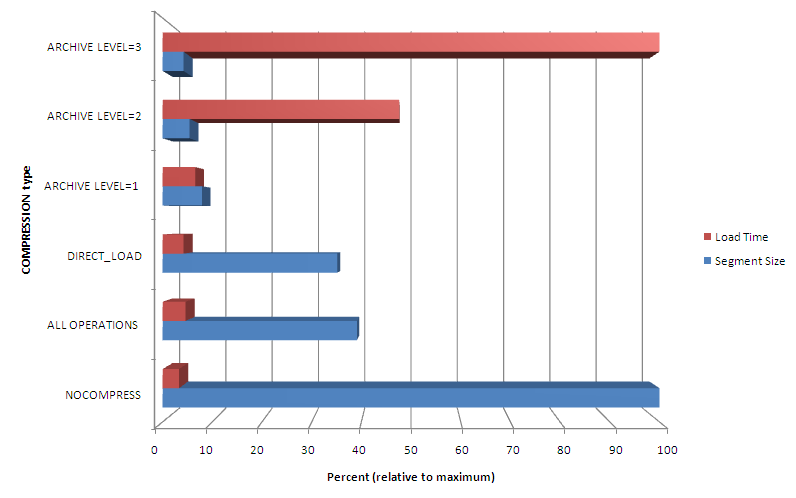
You can see that columnar compression results in much smaller segments sizes than the alternative compression options, but that the time to load the data increases correspondingly.  If a table is relatively static, then using columnar compression would give some very significant improvements to full table scan performance.

There's more on compression - including 11gR2 columnar compression - and other new 11GR2 performance enhancements in my new book Oracle Performance Survival Guide.  It's available for pre-order now, and should be in the stores by the end of the month. 

Errata and apologies

I wrote the above based on research conducted during the 11GR2 beta program.  In the production release there are two very important changes:

  1. Hybrid columnar compression is only available when using exadata storage.
  2. The syntax for specifying the compression levels has changed.  Instead of "ARCHIVE LEVEL=n" the levels are (in order of increasing compression) "QUERY LOW", "QUERY HIGH" and "ARCHIVE". 

I can't speak to Oracle's reasoning behind restricting columnar compression to exadata storage, though in a recent blog entry  Kevin Closson says that it is for technical reasons.    My testing during the beta program used conventional storage. 

I promise in future to re-test always on the production release before posting :-(.