Next Generation
Databases: NoSQL,
NewSQL and Big Data

Buy at Amazon
Buy at Apress

Search

Oracle Performance Survival Guide

Buy It
Read it on Safari
Scripts and Examples
Sample Chapter


 MySQL Stored procedure programming

Buy It
Read it on Safari
Scripts and Examples 


Sunday
Aug302009

Using hints with join methods

Jonathan Lewis often says that hints are generally inadvisable for production systems,  and - with some reservations - I agree.  The most significant problem with hints is that they can go disastrously wrong when schema or other changes to the database occur.  They can also prevent the optimizer from exploiting possible improvements that might otherwise be obtained when new indexes or other changes are made.  If you use hints, you are increasing the amount of care you need to take when making schema changes - especially when changing indexing.

Despite that warning,  hints clearly do have a place when all else fails, and are definitely useful in test environments to compare the costs of various plan options.   In Spotlight on Oracle,  we issue SQL that has very stringent performance requirements against tables (X$ views usually) where we are unable to create histograms and where most other optimization methods are unavailable.  Consequently we fairly routinely hint our production SQL.   We might be special case , but the world is made up of special cases!

In this post I want to provide an example of where a simple hint can go disastrously wrong, and yet at the same time be the only practical way of achieving a certain plan. 

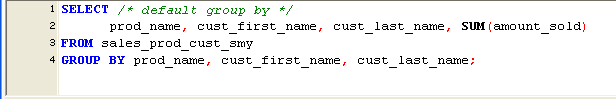
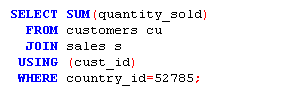
Consider the following SQL:


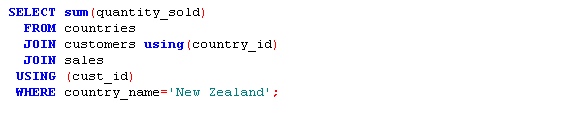
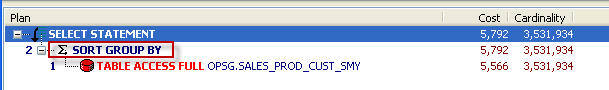
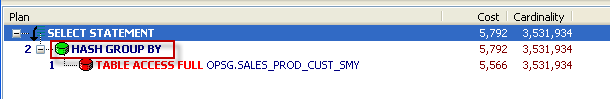
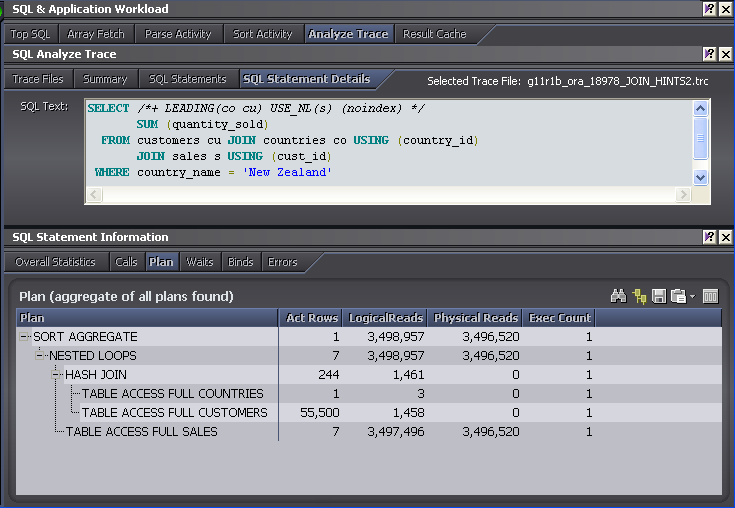
One circumstance in which you might be tempted to use a hint is when you want to specify a join method.  We know that New Zealand - while very lovely - isn't the home of many of our customers and so we probably want to use an indexed based lookup to get their sales data.  However, when we examine the execution plan we see that the optimizer has chosen a hash join and a full table scan of SALES:

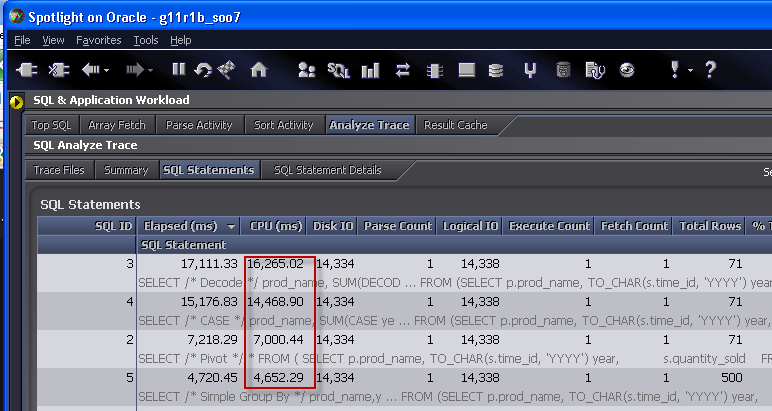
(The output above is from Spotlight on Oracle's Analyze trace facility - tkprof would show much the same output)

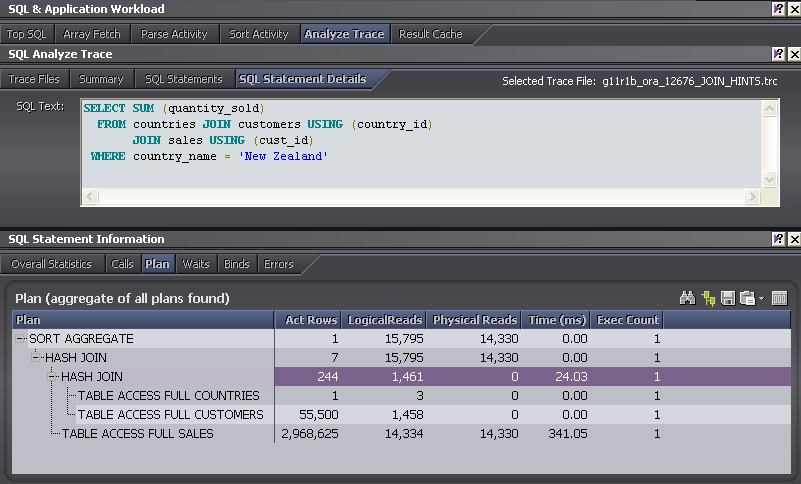
It's easy enough to use a set of hints to get the plan we want.  The USE_NL hint specifies that nested loops should be used for a join, and so here we use it - and a few other hints - to get the join we want:


We get a good reduction in elapsed time (1,000ms->44ms) and logical reads (15,795 -> 1,954), and so this might be considered a successful outcome.  The use of the index based plan reduces physical IO as well, since 11g is using direct reads for the full table scans and so is getting no advantage out of the buffer cache.  

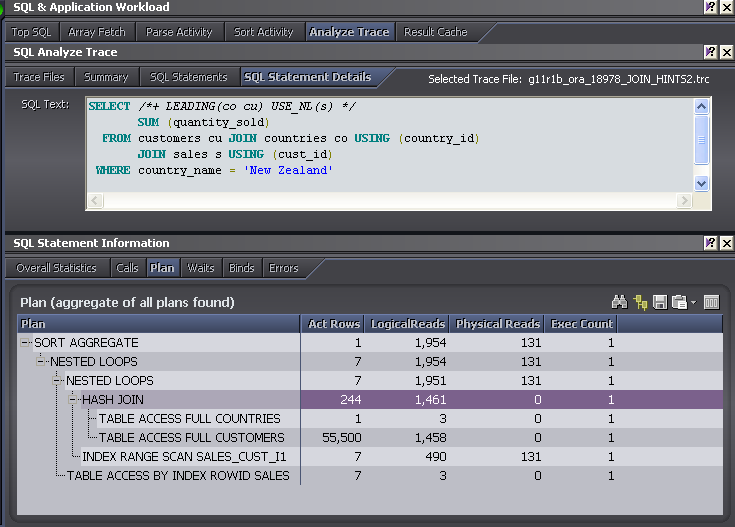
However, we've also created a large vulnerability.  If the index on which the nested loops join is based is ever dropped, or changed in such a way to be unable to support the join, then Oracle will continue to obey the USE_NL hint even though the result will now be a nested table scan.  Here's the plan when the index is dropped:


Truly disastrous!  We are now performing a full table scan of SALES for every matching customer.   The logical reads are now almost 3.5 million, and elapsed time rises to over 80s - 80 times worse than without the hint.

The USE_NL_WITH_INDEX hint


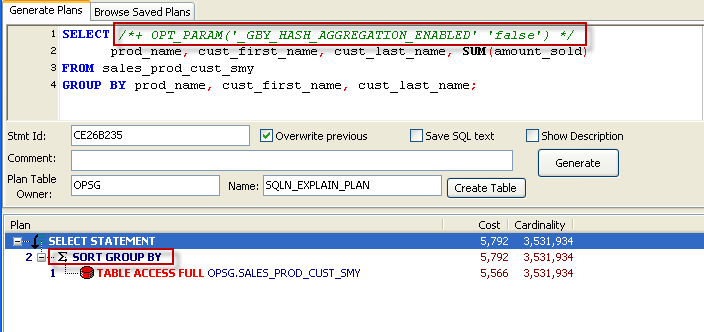
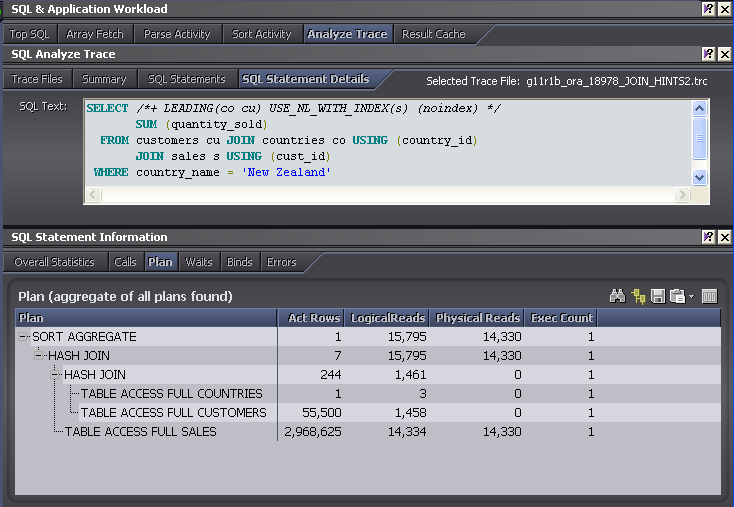
The USE_NL hint has caused enough problems of this type for Oracle to introduce a "safer" alternative: USE_NL_WITH_INDEX.  This works the same as USE_NL but only if there's an index available to support the nested loops.  USE_NL_WITH_INDEX will not result in the nested table scans plan we see above,  if the index is not available it falls back to the hash join:


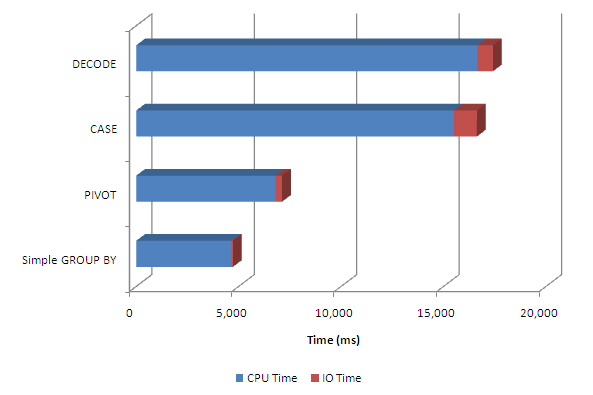
So here's the comparison of the two hints compared with the default plan:


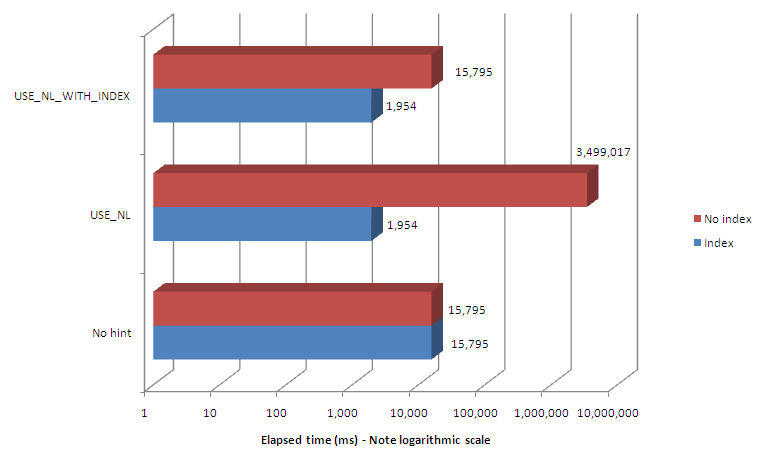
The USE_NL_WITH_INDEX hint is generally preferable to the USE_NL hint because it should never result in nested table scans.


Alternatives to hinting


 When I started writing this, I thought the moral of the story was going to be to collect histograms on skewed columns.  Surely, if I created a histogram on all the join columns, the optimizer would work out that there weren't many New Zealand customers and choose nested loops on it's own, right?

Wrong.  Even with wide histograms on all columns with 100% estimates, Oracle always chose the hash join.

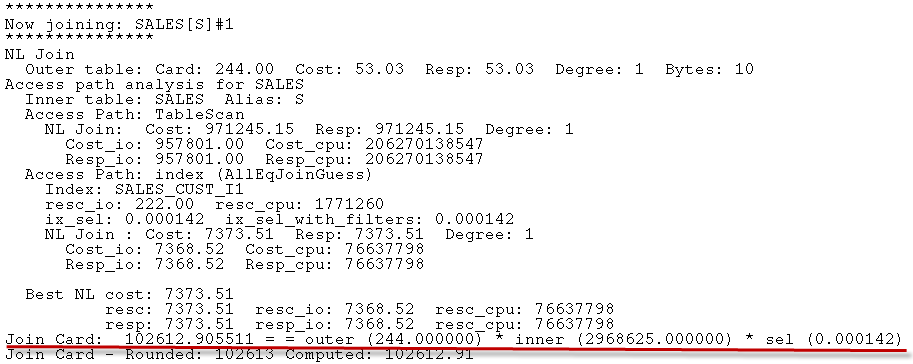
Using the 10053 trace event,  we can see some of the optimizer's thinking and see why the better plan was not chosen.  Here, we see the optimizer calculating the cost for a Nested Loops join between CUSTOMERS and SALES.  The key calculation is underlined in red:

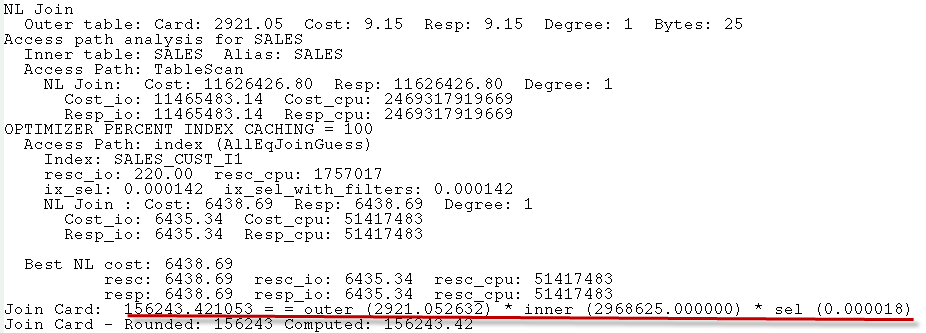
The join cardinality is based on an expected 2,921 rows returned from the outer table - CUSTOMERS - and an index selectivity of .000018.  In fact, there are only 244 customers from New Zealand -  2921 is the average  number of customers across all countries.  From that initial miscalculation, the failure to choose the nested loops join is inevitable.  I thought that histograms on CUSTOMERS.COUNTRY_ID and SALES.CUST_ID might have allowed Oracle to calculate the cardinality correctly.  Sadly not.

Upon reflection, I realized that while the optimizer can work out that the 'New Zealand' row in COUNTRIES returns only one row, it cannot- without actually executing the statement - work out how many matching rows exist in the CUSTOMERS table.  If we provide the COUNTRY_CODE directly as in this statement:

Then we can see in the 10053 trace that the cardinality is correctly determined.  The calculation below - that there will be 244 customer rows returned - is correct:

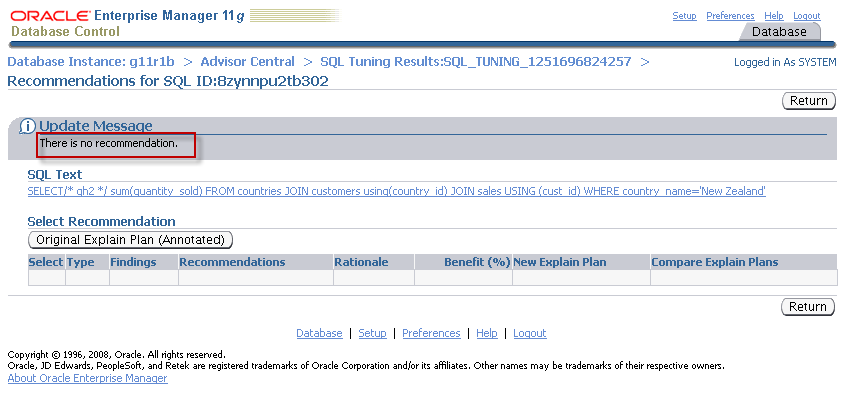
SQL Tuning advisor to the rescue? (No)

In theory, the SQL tuning advisor ought to be able to compare the actual rows output from each step during execution and then adjust the estimated rows accordingly.  I therefore had high hopes that running the advisor on my statement would give me the result I wanted.  However, it really was not my day.  The SQL tuning advisor was unable to provide an alternative plan either:


Changing the optimizers assumptions


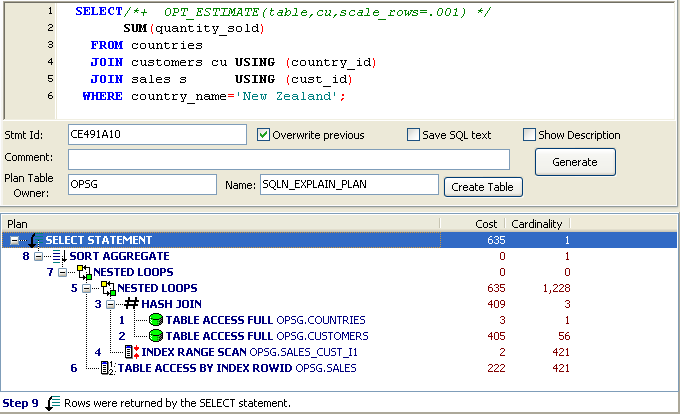
Maybe we would be best off changing the optimizers assumptions...  Since it's the failed cardinality that is at the root of the problem, let's try to adjust that.  OPT_ESTIMATE is the undocumented hint that SQL profiles use to adjust the plan.  We can use it to adjust the expected cardinality of the CUSTOMERS lookup by .001.  This will reduce the number of rows expected to be returned by 1/100th.

And it works: we get the index based nested loops:

 Is this better than the USE_NL_WITH_INDEX hint?  Possibly, though things could go wrong if the data volumes and distributions change.   What I really want is to be able to collect a "join histogram" that will allow Oracle to determine the number of rows returned from CUSTOMERS when joined to the New Zealand COUNTRIES row.   I can't think of an obvious and simple way to do that;  we can only hope that future versions of DBMS_SQLTUNE (the SQL tuning advisor) can correct join issues like this.

Conclusion

Hints in production code should definitely be used with care.  We've seen an example above where a hint can result in massive SQL degradation when indexing changes.  Some hints are "safer" than others - USE_NL_WITH_INDEX is better than USE_NL for instance. 

It can sometimes be surprisingly hard, however, to get Oracle to do the right thing.  In a perfect world we should be able to get the plan we want through accurate and comprehensive statistics or - if that fails - by running the SQL access advisor and creating a profile.  Alas,  it still seems that even for fairly simple cases - involving joins in particular - the optimizer will fail to determine the correct path.  In those cases,  hints seem to be the only option if we want to get the most efficient path.


Wednesday
Aug052009

Optimizing GROUP and ORDER BY


Starting with Oracle 10.2,  you may notice a significant degradation in relative performance when you combine a GROUP BY with an ORDER BY on the same columns. 

Oracle introduced a hash-based GROUP BY in 10.2.  Previously, a GROUP BY operation involved sorting the data on the relevent columns, then accumulating aggregate results.   The hash GROUP BY method creates the aggregates without sorting, and is almost always faster than sort-based GROUP BY.  Unfortunately, when you include an ORDER BY clause on the same columns as those in the GROUP BY Oracle reverts to the older sort-based GROUP BY with a corresponding drop in performance.   However, you can reword your SQL to take advantage of the hash-based GROUP BY while still getting your data in the desired order.

For example, consider this simple statement:

Prior to 10.2, the statement would be executed using a SORT GROUP BY operation:


From 10.2 onwards, we can expect to see the HASH GROUP BY :

As Alex Gorbachev  noted,  the new GROUP BY can return bad results in early versions (prior to 11.1.0.7 or 10.2.0.4).  You can disable by setting the parameter _GBY_HASH_AGGREGATION_ENABLED to FALSE.  Below, we use the OPT_PARAM hint to set this for an individual SQL;  you could also use ALTER SESSION or ALTER SYSTEM to change the parameter at the session or instance level:


The other thing to remember is that you can't rely on GROUP BY returning rows in order;  prior to 10.2 GROUP BY  would usually return the rows in the GROUP BY order, and some of us may have consequently not bothered to add an ORDER BY clause.  On upgrading to 10.2, you might have been surprised to see queries suddenly return data in apparently random order.  Tom Kyte talks about this here:  as a general rule you should never  rely on a side-effect to get rows in a particular order.  If you want them in order, you should always specify the ORDER BY clause.

Generally speaking, the new hash GROUP BY is much more efficient than the older sort method.   Below we see the relative performance for the two GROUP BY algorithms when grouping a sample table of 2.5 million rows into about 200,000 aggregate rows:

Your results may vary of course, but I've not seen a case where a SORT GROUP BY outperformed a HASH GROUP BY. 

Unfortunately,  Oracle declines to use the HASH GROUP BY in some of the circumstances in which it might be useful.  It's fairly common to have a GROUP BY and an ORDER BY on the same columns.  After all, you  usually don't want an aggregate report to be in random order. 

When Oracle uses the SORT GROUP BY, the rows are returned in the grouping order as a side effect of the sort.  So in the example below, there is just one SORT - it supports both the GROUP BY and ORDER BY (note that i've turned off the HASH GROUP BY using the OPT_PARAM hint):


The above plan is what you'd expect to see prior to 10.2 - since the HASH GROUP BY is not available in that release. 

However, when we examine the execution plan in 11g or 10.2  we find that Oracle still chooses the SORT GROUP BY:


Here's the important point:

When you combine a GROUP BY and an ORDER BY on the same column list,  Oracle will not use the HASH GROUP BY option.


Presumably, the optimizer "thinks" that since the SORT GROUP BY allows Oracle to get the rows in sorted order while performing the aggregation, it's best to use SORT GROUP BY when the SQL requests an ORDER BY as well as the GROUP BY.  However, this logic is seriously flawed.  The inputs to the ORDER BY will normally be far fewer rows than the inputs in to the GROUP BY.  In our example above, the GROUP BY processes about 2.5 million rows, while the ORDER BY sorts only about 200,000 rows:  it really doesn't make sense to de-optimize the expensive GROUP BY to optimize a relatively cheap ORDER BY. 

Is there a way to force Oracle to use the HASH GROUP BY even if we have the ORDER BY?  I'm not aware of an optimizer parameter or hint, but I was able to persuade Oracle to use the HASH GROUP BY by putting the GROUP BY in a subquery, the ORDER BY in the outer query, and using the NO_MERGE hint to avoid having the subquery merged into the outer query.  Here's my query and execution plan showing that I get a HASH GROUP BY together with SORT ORDER BY:


You might think that doing a single SORT GROUP BY is better than doing both a HASH GROUP BY and a SORT ORDER BY.  But remember,the SORT ORDER BY only has to sort the grouped rows - about 200,000 in my example - while the GROUP BY has to process the entire contents of the table - about 2.5 million in my sample table.  So optimizing the GROUP BY is often more important than avoiding a small second sort.

Here's a comparison of performance between the two approaches:

The rewrite reduced elapsed time by about 2/3rds.

Conclusion

When a GROUP BY is associated with an ORDER BY on the same columns,  the Oracle optimizer may choose a SORT GROUP BY rather than the usually more efficient HASH GROUP BY.  Using the SORT GROUP BY avoids adding a SORT ORDER BY to the plan, but the overall result is usually disappointing.

To get a better result, you can perform the GROUP BY in an in-line view and perform the ORDER BY in the outer query.  Use the NO_MERGE hint to prevent the two operations from being combined.


Tuesday
Jul282009

Pivot performance in 11g

"Pivoting" a result set - mapping values in a particular row to columns - is a commonplace activity when analyzing data in spreadsheets, but has always been a bit awkward in SQL.  The PIVOT operator - introduced in Oracle 11g - makes it a somewhat easier and - as we'll see - more efficient.

Prior to PIVOT, we would typically use CASE or DECODE statements to create columns that contained data only if the pivot column had the appropriate value.  For instance, to produce a report of product sales by year, with each year shown as a separate column, we might use a query like this:


You can use either CASE or DECODE to map specific values to specific columns.  CASE is more modern and possibly a better general purpose tool, but DECODE works fine.

PIVOT provides a more succinct syntax, though we still need to specify the exact column values we want (for instance, it would be nice below to be able to somehow specify "all years" instead of having to itemize the specific years to be mapped to columns):


So new syntax is all very well, but does it make a difference to performance?   Comparison of the execution plans shows very little difference between the two approaches.  Below we see the CASE based plan on the left and the PIVOT plan on the right.  Both plans have identical cost and - other than for a PIVOT option in the GROUP BY clause - exactly the same plan:


It's very,very common for the cost calculations in the optimizer to lag behind new operations, so we don't want to take the cost estimate as gospel.  It's clear that Oracle doesn't have a clue as to the overhead of actually performing the pivot, since a simple GROUP BY with no pivot operation generates exactly the same cost:


However, generating and analyzing a SQL trace with the CASE, DECODE and PIVOT alternatives showed that PIVOT was a lot less CPU intensive.  The following is from Spotlight on Oracle but of course you could use tkprof to get most of the relevant data from the trace file:


Each approach - CASE, DECODE, PIVOT - involved about the same amount of physical and logical IO, but the PIVOT used much less CPU - less than half.  Since I love charts, here's the same data in a chart:


 PIVOT is a bit more expensive than just spitting out the raw data (and maybe pivoting in Excel), but it's way cheaper than the CASE or DECODE based alternatives.

When we use the CASE approach, we force Oracle to perform multiple CASE statement expressions on every row before the GROUPING.  These evaluations are very CPU intensive and it's easy to imagine that the PIVOT algorithm could be more efficient.  However, it's interesting to see that - as yet - the optimizer is unable to factor in the cost of either the CASE or the PIVOT.  

In summary,  PIVOT seems to be pretty efficient, and certainly much less CPU intensive than the pre-11g CASE or DECODE alternatives.


Monday
Jul132009

SIGNAL and RESIGNAL in MySQL 5.4 and 6.0


One of the most glaring omissions in the MySQL Stored procedure implementation was the lack of the ANSI standard SIGNAL and RESIGNAL clauses.  These allow a stored procedure to conditionally return an error to the calling program.

When Steven and I wrote MySQL Stored Procedure programming we lamented this omission, and proposed an admittedly clumsy workaround.  Our workaround involved creating and procedure in which dynamic SQL in which the error message was embedded in the name of a non-existent table.  When the procedure was executed, the non-existing table name at least allowed the user to see the error.  So for instance, here is the my_signal procedure:


When you want to raise an error, you call MY_SIGNAL and pass the text of the error you want to throw:


This causes a 'Table doesn't exist error', but the name of the table is quoted, which contains the error text:


Clumsy in the extreme,  but this was about the best one could do in MySQL 5.0 and 5.1.  At last, relief is in sight:  MySQL 5.4 and 6.0 have implemented the SIGNAL and RESIGNAL clauses.  SIGNAL and RESIGNAL are available in the latest drop of 6.0 (6.0.11) and - I believe - in 5.4.4.  The SIGNAL clause is documented here;  the RESIGNAL clause is documented in the same chapter.  The examples below are from 6.0.11, but I believe the behavior in 5.4.4 is the same.

With SIGNAL, we can get rid of the clumsy MY_SIGNAL procedure, and simply code the error we want to send directly:


The error message is cleaner, and we don't get the misleading mysql error code:


 You can use RESIGNAL in a similar way to send on an error message that you have already caught.  So let's say that in the event of a duplicate key on index error you want to insult the user before returning the MySQL error.  Here's how you'd do it:


When the duplicate insert is attempted the EXIT handler from line 8 fires and executes the SELECT and ROLLBACK statements (lines 10-12).  Finally the RESIGNAL clause on line 13 causes the original error to be raised:


SIGNAL and RESIGNAL make a huge difference to the usability and reliability of Stored procedures.  In fact,  I beleive that MySQL should never have released a stored procedure implementation without them.  Oh well, better late than never.

However, stored procedures are still missing a mechanism for catching the SQLCODE or SQLSTATE within the stored procedure code.  THis means that in a general purpose error handler, you can't know what the error was.  Instead, you have to code an error handler for every possible condition.  As Roland Bourman  has shown,  this has a measurable performance impact and also leads to verbose and messy code.   The correct implementation is to implement something along the lines of the ANSI GET DIAGNOSTICS command, and this is a low (!) priority enhancement probably not going to be seen before MySQL 7.0.  That's a drag.


Sunday
Jul052009

Oracle disk IO latency on EC2 


A colleague pointed me to this blog post , in which one attendees at a cloud computing panel described disk IO in the cloud (presumably AWS) as "punishingly slow".

We use EC2 for testing purposes here in the Spotlight on Oracle team, and generally we’ve been pretty happy – at least with throughput. Latency is a bit of a mixed bag however. Here’s a typical db file sequential read histogram from one of our bigger EC2 instances (from Spotlight on Oracle):

We do a fair bit of benchmark related workloads, so of course we often overload the disks. However, the two peaks in the above chart are interesting. The 1 ms peak is clearly caching of some form – disks simply cannot return blocks of data in 1ms for random reads given rotational latency, etc. The 1 ms disk reads are probably coming from a non-volatile cache incorporated with the virtual disks (and yes, Oracle was configured with filesystemio_options set to ‘setall’, so filesystem caching was not in effect)

The 16ms peak is poor if that represents the actual physical service time of the disk; but it might be due to overloading the disks and creating some queuing. Let’s try and find out.

When you create an EC2 instance, by default your storage is “ephemeral” – non permanent. It’s more sensible therefore to create datafiles on Elastic Block Storage (EBS) devices that will not evaporate should your instance crash. I was interested in the relative performance of both. You probably never want to store tables on ephemeral storage, but maybe they could be used for temporary or index tablespaces.

I created two tables, one on a EBS backed tablespace and one on ephemeral storage. The table had a 7K row length, so each row was in a block of its own. I then retrieved blocks from the table in sequential order after – of course – flushing the buffer cache and making sure filesystemio_options where set to “setall”. The primary key indexes were on separate tablespaces, so we’re only seeing the IO from the table reads.

These first results were very good (this is from V$FILE_HISTOGRAM):

These results show that Ephemeral is a bit faster than EBS, but that EBS still seems VERY fast. Too good to be true in fact: must be some caching going on in the EBS storage layer.

I restarted the instance (and database of course) and waited a few hours. Hoping that whatever cache exists had been purged. However, the results were not much different.  Perhaps my 8K block reads were piggy-backing on a larger block size in Amazon storage?   So the first time I read an 8K block it takes 4-8ms, but when I then read a "nearby" block, it's already cached?

So next, I tried performing random reads on a really massive table to try and prevent this sort of caching. I used SQL trace to capture all the db file sequential read times.  The following perl snippet was used to collect the distribution of IO times (77203 is the obj# of my test table):


Now we see something that looks like it might reflect more accurately the non-cached EBS response time:


These times aren’t that great, but aren’t totally outside the range of what we’re used to in JBOD (Just A Bunch Of Disks).

So based on this little bit of research, here’s my current take on EC2 IO latency:

  1. The underlying disk system implements some form of caching: as a result disk reads often appear to be super-fast if they are pick up data in the storage cache. For a typical database, this will make some proportion of single block reads appear to complete in 1ms range.
  2. When the cache is bypassed, latencies of between 4-10 ms can be expected.
  3. Ephemeral storage appears to be somewhat faster that EBS.  You'd be nuts to put any data you wanted to keep on ephemeral storage, but maybe we could consider using it for temporary tablespaces. 

I did a little bit of work on throughput while writing Oracle Performance Survival Guide.  Here's a chart that shows an attempt to push up read throughput on an EBS based tablespace:

I really need to spend some more time benchmarking throughput, but based on this simple test,  it seems like you can get a couple of hundred IOPS out of an EBS filesystem before latency starts to run away.