Next Generation
Databases: NoSQL,
NewSQL and Big Data

Buy at Amazon
Buy at Apress

Search

Oracle Performance Survival Guide

Buy It
Read it on Safari
Scripts and Examples
Sample Chapter


 MySQL Stored procedure programming

Buy It
Read it on Safari
Scripts and Examples 


Entries by Guy Harrison (96)

Monday
Sep172012

Exadata Smart Flash Logging–Outliers

In my last post, I looked at the effect of the Exadata smart flash logging.  Overall,  there seemed to be a slight negative effect on median redo log sync times.  This chart (slightly different from the last post because of different load and configuration of the system), shows how there’s a “hump” of redo log syncs that take slightly longer when the flash logging is enabled:

image

But of course, the flash logging feature was designed to improve performance not of the “average” redo log sync, but of the “outliers”. 

In my tests, I had 40 concurrent processes writing redo as fast as they could.  Occasionally this would result in some really long wait times.  For instance, in this trace you see an outlier of 291,780 microseconds (the biggest outlier in my tests BTW) within an otherwise unremarkable set of waits:

WAIT #47124064145648: nam='log file sync' ela= 1043 buffer#=101808 sync scn=1266588527 p3=0 obj#=-1 tim=1347583167588250
WAIT #47124064145648: nam='log file sync' ela= 2394 buffer#=130714 sync scn=1266588560 p3=0 obj#=-1 tim=1347583167590888
WAIT #47124064145648: nam='log file sync' ela= 932 buffer#=101989 sync scn=1266588598 p3=0 obj#=-1 tim=1347583167592057
WAIT #47124064145648: nam='log file sync' ela= 291780 buffer#=102074 sync scn=1266588637 p3=0 obj#=-1 tim=1347583167884090
WAIT #47124064145648: nam='log file sync' ela= 671 buffer#=102196 sync scn=1266588697 p3=0 obj#=-1 tim=1347583167885294
WAIT #47124064145648: nam='log file sync' ela= 957 buffer#=102294 sync scn=1266588730 p3=0 obj#=-1 tim=1347583167886575

To see if the flash logging feature was successful in removing these outliers, I extracted the top 10,000 waits from each of the roughly 8,000,000 waits I recorded in each category.  Here’s a plot (non-logarithmic) of those waits:

image

So – the flash log feature was effective in eliminating or at least reducing very extreme outlying redo log sync times.    Most redo log sync operations will experience no improvement or maybe even a slight degradation. But for the small number of log syncs that would have experienced a really excessive delay, the feature works as advertised – it reduces the chance of really excessive log file syncs. 

In my opinion, this effect doesn't imply that the flash can process a redo log write faster than the magnetic disks - in fact probably the opposite is true.  But given two desitinations to choose from, we avoid really long delays that occur when one of the destinations only is overloaded. 

Thursday
Aug092012

Exadata smart flash logging

Exadata storage software 11.2.2.4 introduced the Smart flash logging feature.  The intent of this is to reduce overall redo log sync times - especially outliers - by allowing the exadata flash storage to serve as a secondary destination for redo log writes.  During a redo log sync, Oracle will write to the disk and flash simultaneously and allow the redo log sync operation to complete when the first device completes. 

Jason Arneil reports some initial observations here, and Luis Moreno Campos summarized it here.

I’ve reported in the past on using SSD for redo including on Exadata and generally I’ve found that SSD is a poor fit for redo log style sequential write IO.  But this architecture should at least do now harm and on the assumption that the SSD will at least occasionally complete faster than a spinning disk I tried it out. 

My approach involved the same workload I’ve used in similar tests.  I ran 20 concurrent processes each of which performed 200,000 updates and commits – a total of 4,000,000 redo log sync operations.  I captured every redo log sync wait from 10046 traces and loaded them in R for analysis.

I turned flash logging on or off by using an ALTER IORMPLAN command like this (my DB is called SPOT):

ALTER IORMPLAN dbplan=((name='SPOT', flashLog=$1),(name=other,flashlog=on))'

And I ran “list metriccurrent where objectType='FLASHLOG'” before and after each run so I could be sure that flash logging was on or off.

When flash logging was on, I saw data like this:

Before:

     FL_DISK_FIRST                     FLASHLOG     32,669,310 IO requests
     FL_FLASH_FIRST                    FLASHLOG     7,318,741 IO requests
     FL_PREVENTED_OUTLIERS             FLASHLOG     774,146 IO requests

After:

      FL_DISK_FIRST                     FLASHLOG     33,201,462 IO requests
     FL_FLASH_FIRST                    FLASHLOG     7,337,931 IO requests
     FL_PREVENTED_OUTLIERS             FLASHLOG     774,146 IO requests


So for this particular cell the flash disk “won” only 3.8% of times (7,337,931-7,318,741)*100/(7,337,931-7,318,741+33,201,462-32,669,310) and prevented no “outliers”.  Outliers are defined as being redo log syncs that would have taken longer than 500 ms to complete. 

Looking at my 4 million redo log sync times,  I saw that the average and median times where statistically significantly higher when the smart flash logging was involved:

> summary(flashon.data$synctime_us) #Smart flash logging ON
   Min. 1st Qu.  Median    Mean 3rd Qu.    Max.
    1.0   452.0   500.0   542.4   567.0  3999.0
> summary(flashoff.data$synctime_us) #Smart flash logging OFF
   Min. 1st Qu.  Median    Mean 3rd Qu.    Max.
   29.0   435.0   481.0   508.7   535.0  3998.0
> t.test(flashon.data$synctime_us,flashoff.data$synctime_us,paired=FALSE)

    Welch Two Sample t-test

data:  flashon.data$synctime_us and flashoff.data$synctime_us
t = 263.2139, df = 7977922, p-value < 2.2e-16
alternative hypothesis: true difference in means is not equal to 0
95 percent confidence interval:
33.43124 33.93285
sample estimates:
mean of x mean of y
542.3583  508.6763

Plotting the distribution of redo log sync times we can pretty easily see that there’s actually a small “hump” in times when flash logging is on (note logarithmic scale):

image

This is of course the exact opposite of what we expect, and I checked my data very carefully to make sure that I had not somehow switched samples.  And I repeated the test many times and always saw the same pattern.  

It may be that there is a slight overhead to running the race between disk and flash, and that that overhead makes redo log sync times slightly higher.  That overhead may become more negligible on a busy system.  But for now I personally can’t confirm that smart flash logging provides the intended optimization and in fact I observed a small but statistically significant and noticeable degradation in redo log sync times when it is enabled.

Friday
Jan062012

Getting started with Apache Pig

If, like me, you want to play around with data in a Hadoop cluster without having to write hundreds or thousands of lines of Java MapReduce code, you most likely will use either Hive (using the  Hive Query Language HQL) or Pig.

Hive is a SQL-like language which compiles to Java map-reduce code, while Pig is a data flow language which allows you to specify your map-reduce data pipelines using high level abstractions. 

The way I like to think of it is that writing Java MapReduce is like programming in assembler:  you need to manually construct every low level operation you want to perform.  Hive allows people familiar with SQL to extract data from Hadoop with ease and – like SQL – you specify the data you want without having to worry too much about the way in which it is retrieved.  Writing a Pig script is like writing a SQL execution plan:  you specify the exact sequence of operations you want to undertake when retrieving the data.  Pig also allows you to specify more complex data flows than is possible using HQL alone.

As a crusty old RDBMS guy, I at first thought that Hive and HQL was the most attractive solution and I still think Hive is critical to enterprise adoption of Hadoop since it opens up Hadoop to the world of enterprise Business Intelligence.  But Pig really appeals to me as someone who has spent so much time tuning SQL.  The Hive optimizer is currently at the level of early rule-based RDBMS optimizers from the early 90s.  It will get better and get better quickly, but given the massive size of most Hadoop clusters, the cost of a poorly optimized HQL statement is really high.  Explicitly specifying the execution plan in Pig arguably gives the programmer more control and lessens the likelihood of the “HQL statement from Hell” brining a cluster to it’s knees.

So I’ve started learning Pig, using the familiar (to me) Oracle sample schema which I downloaded using SQOOP.   (Hint:  Pig likes tab separated  files, so use the --fields-terminated-by '\t' flag in your SQOOP job). 

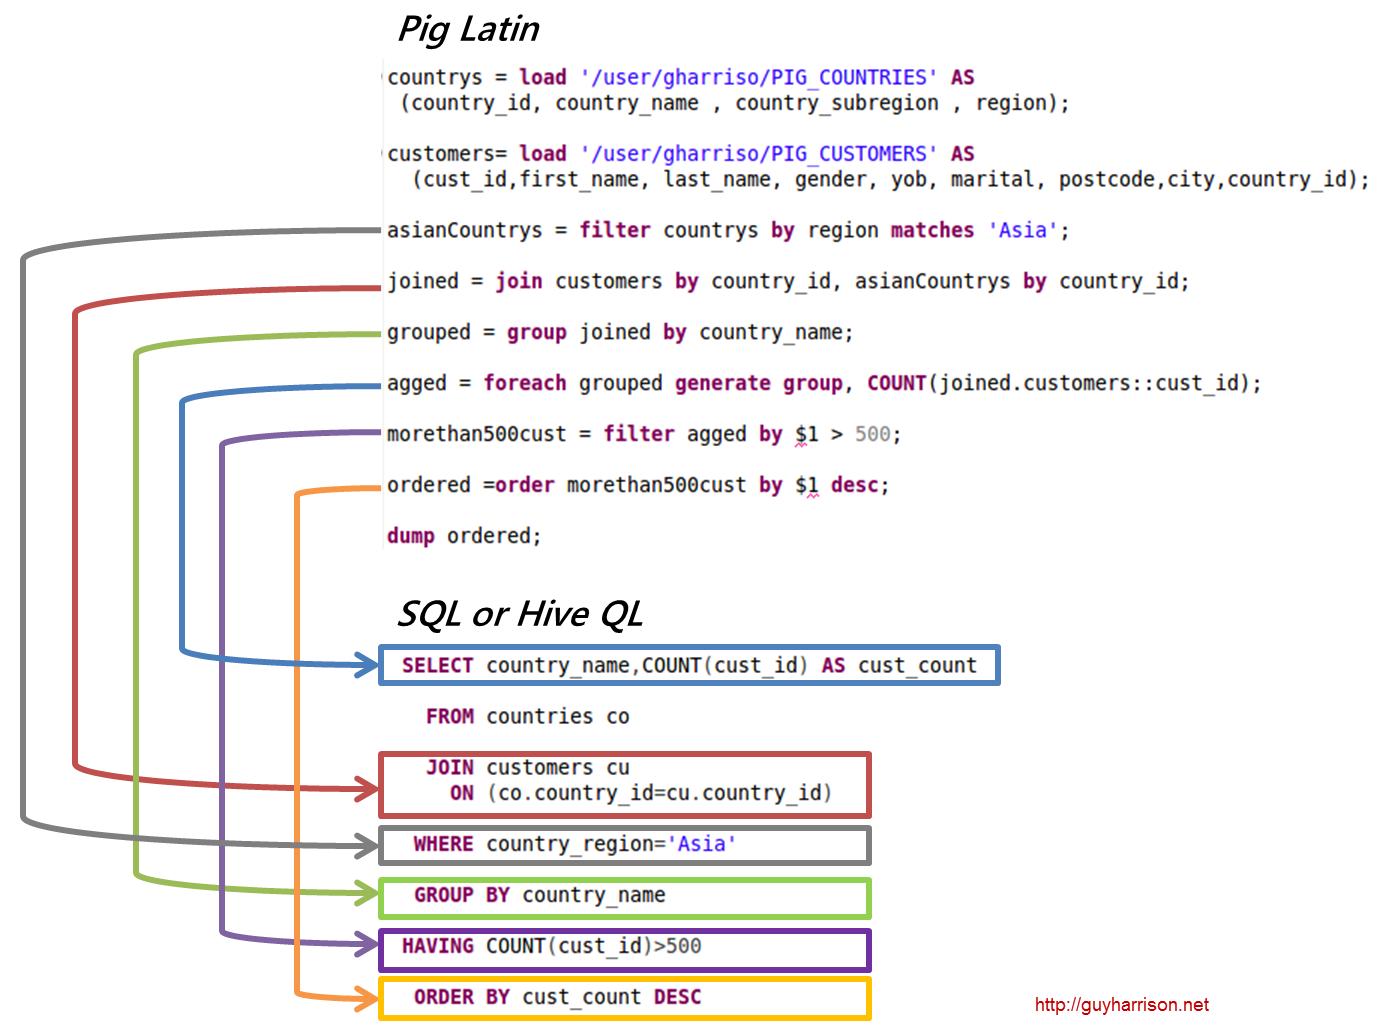
Here’s a diagram I created showing how some of the more familiar HQL idioms are implemented in Pig:

Note how using Pig we explicitly control the execution plan:  In HQL it’s up to the optimizer whether tables are joined before or after the “country_region=’Asia’” filter is applied.  In Pig I explicitly execute the filter before the join.    It turns out that the Hive optimizer does the same thing, but for complex data flows being able to explicitly control the sequence of events can be an advantage. 

Pig is only a little more wordy than HQL and while I definitely like the familiar syntax of HQL I really like the additional control of Pig.

Tuesday
Dec062011

Using SSD for redo on Exadata - pt 2

In my previous post on this topic, I presented data showing that redo logs placed on an ASM diskgroup created from exadata griddisks created from flash performed far worse than redo logs placed on ASM created from spinning SAS disks.

Of course, theory predicts that flash will not outperform spinning magnetic disk for the sequential write IOs experienced by redo logs, but on Exadata, flash disk performed much worse than seemed reasonable and worse than experience on regular Oracle with FusionIO SSD would predict (see this post).

Greg Rahn and Kevin Closson were both kind enough to help explain this phenomenon.  In particular, they pointed out that the flash cards might be performing poorly because of the default 512 byte redo block size and that I should try a 4K blocksize.   Unfortunately, at least on my patch level (11.2.2.3.2), there appears to be a problem with setting a 4K blocksize

ALTER DATABASE add logfile thread 1 group 9 ('+DATA_SSD') size 4096M blocksize 4096
*
ERROR at line 1:
ORA-01378: The logical block size (4096) of file +DATA_SSD is not compatible with the disk sector size (media sector size is 512 and host sector size is 512)

According to Greg, the F20 SSD cards are incorrectly reporting their physical characteristics and this is fixed in the current patch level.   Luckily, you can override the check by setting

ALTER SYSTEM SET "_disk_sector_size_override"=TRUE SCOPE=BOTH;

Greg and Kevin really know their stuff:  setting a 4k redo log block size resulted in dramatic improvements to redo log throughput – elapsed time reduced by 70%:

image

As expected,  redo log performance for SSD still slightly lags that of SAS spinning disks.     It’s clear that you can’t expect a performance improvement by placing redo on SSD, but at least the 4K blocksize fix makes the response time comparable.  Of course, with the price of SSD being what it is, and the far higher benefits provided for other workloads – especially random reads – it’s hard to see an economic rationale for SSD-based redo.    But at least with a 4K blocksize it’s tolerable.

When our Exadata system is updated to the latest storage cell software, I’ll try comparing workloads with the Exadata smart flash logging feature.

Monday
Dec052011

Amazon Elastic Map Reduce (EMR), Hive, and TOAD

Since my first post on connecting to Amazon Elastic Map Reduce with TOAD, we’ve added quite a few features to our Hadoop support in general and our EMR support specifically, so I thought I’d summarize those features in this blog post

Amazon Elastic Map Reduce is a cloud-based version of Hadoop hosted on Amazon Elastic Compute Cloud (EC2) instance.  Using EMR, you can quickly establish a cloud based Hadoop cluster to perform map reduce work flows. 

EMR support Hive of course, and Toad for Cloud Databases (TCD)  includes Hive support, so let’s look at using that to query EMR data.

Using the Toad direct Hive client


TCD direct Hive connection support is the quickest way to establish a connection to Hive.  It uses a bundled JDBC driver to establish the connection.

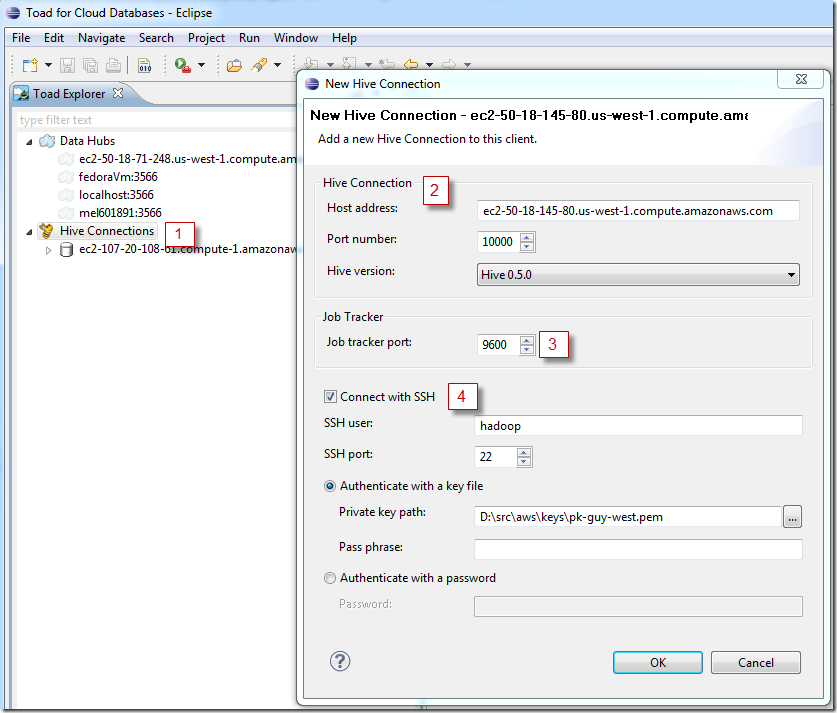
Below we create a new connection to a Hive server running on EMR:

image

  1. Right click on Hive connections and choose “Connect to Hive” to create a new Hive connection.
  2. The host address is the “Master” EC2 instance for your EMR cluster.  You’ll find that on the EMR Job flow management page within your Amazon AWS console.  The Hive 0.5 server is running on port 10000 by default.
  3. Specifying a job tracker port allows us to track the execution of our Hive jobs in EMR.  The standard Hadoop jobtracker port is 50030, but in EMR it’s 9600.
  4. It’s possible to open up port 10000 so you can directly connect with Hive clients, but it’s a bad idea usually.  Hive has negligible built-in security, so you’d be exposing your Hive data.   For that reason we support a SSH mode in which you can tunnel through to your hadoop server using the keypair file that you used to start the EMR job flow.  The key name is also shown in the EMR console page, though obviously you’ll need to have an actual keypair file.

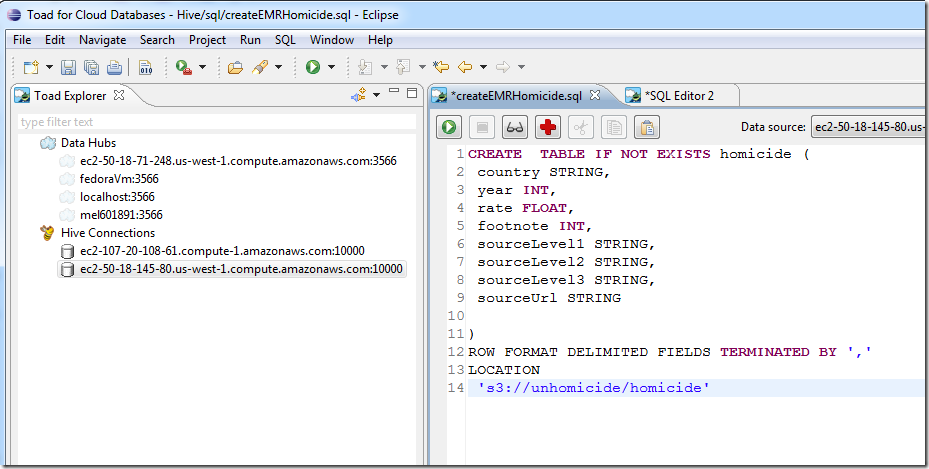
The direct Hive client allows you to execute any legal Hive QL commands.  In the example below, we create a new Hive table based on data held in an S3 bucket (The data is some UN data on homicide rates I uploaded).

SNAGHTML9c66e8d

Connecting Hive to the Toad data hub


It’s great to be able to use Hive to exploit Map Reduce using familiar (to me) SQL-like syntax.  But the real advantage of TCD for Hive is that we link to data that might be held in other sources – like Oracle, Cassandra, SQL Server, MongoDB, etc.

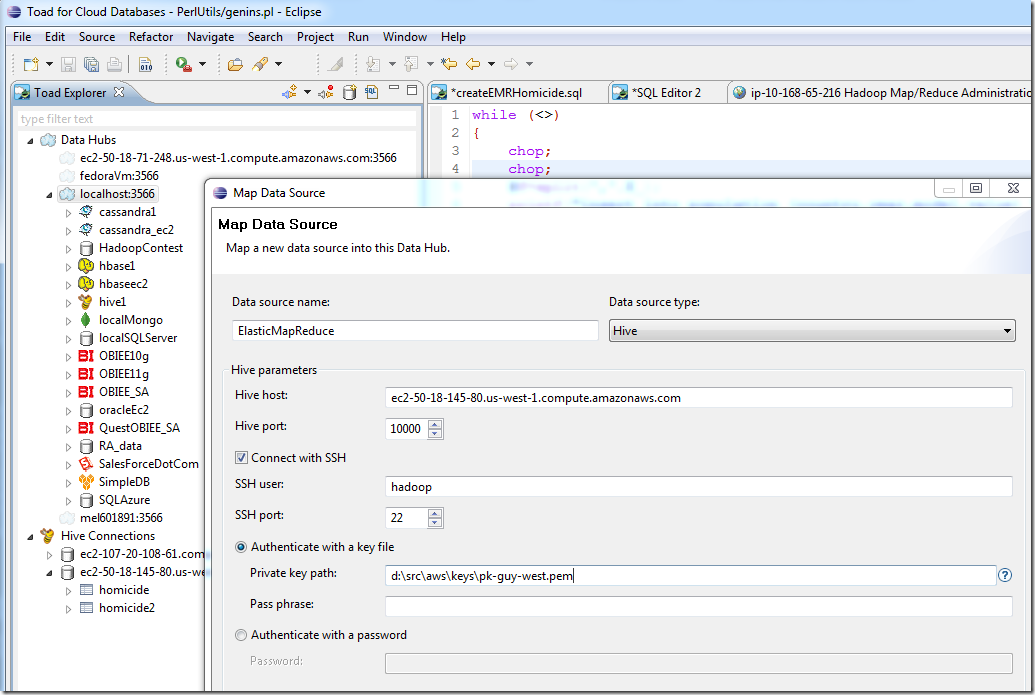
Setting up a hub connection to EMR hive is very similar to setting up a direct connection.  Of course you need a data hub installed (see here for instructions), then right click on the hub node and select “map data source”:

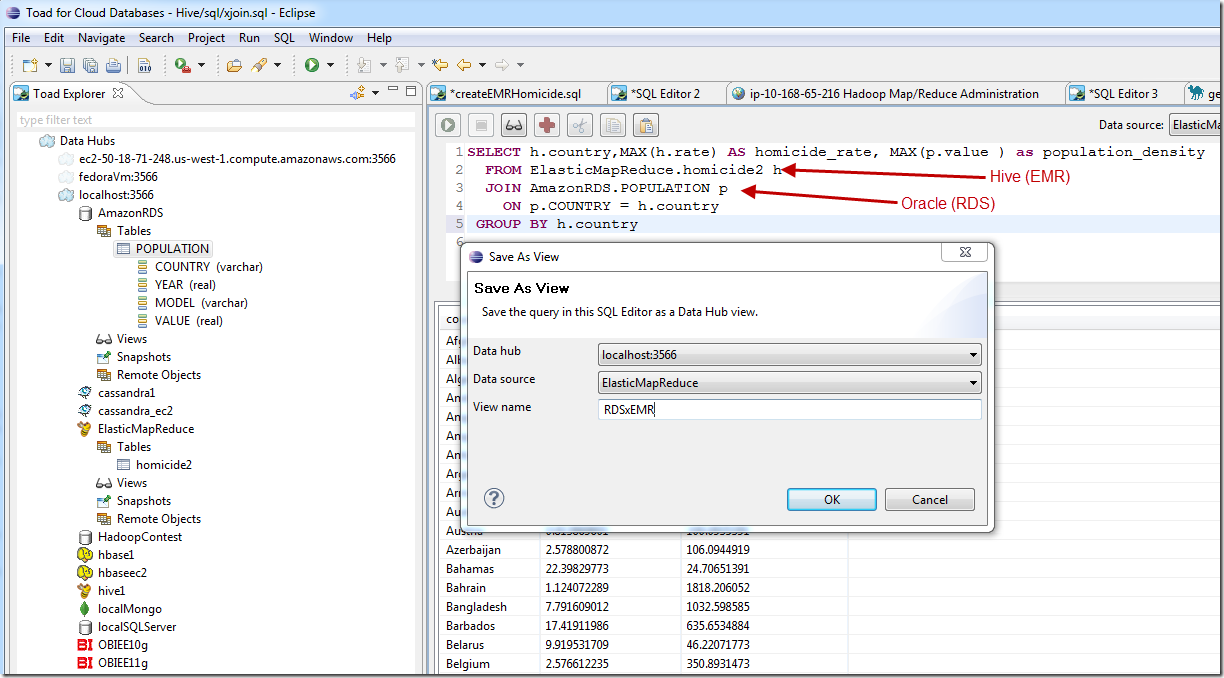
Now that the hub knows about the EMR hive connection, we can issue queries that access Hive and – in the same SQL – other datasources. For instance, here’s a query that joins homicide data in Hive Elastic Map Reduce with population data stored in a Oracle database (running as Amazonn RDS:  Relational Database Service).  We can do these cross platform joins across a lot of different types of database sources, including any ODBC compliant databases, any Apache Hbase or Hive connections, Cassandra, MongoDB, SimpleDB, Azure table services:

In the version that we are just about to release, queries can be saved as views or snapshots, allowing easier access from external tools of for users who aren’t familiar with SQL.   In the example above, I’m saving my query as a view.


Using other hub-enabled clients


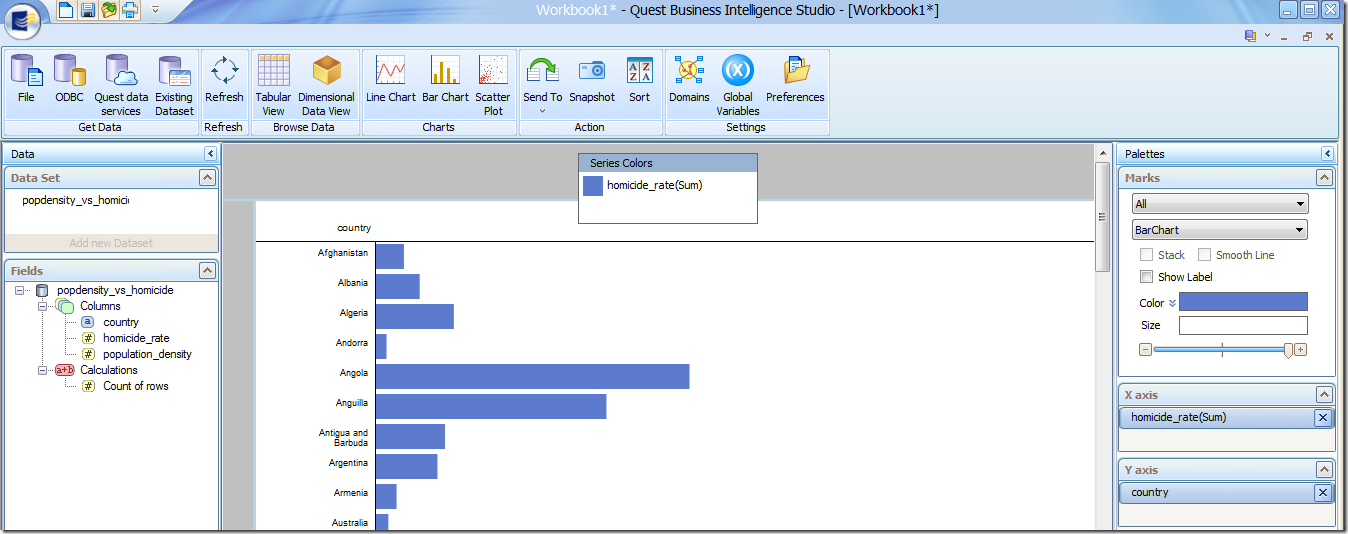
TCD isn’t the only product that can issue hub queries.  In beta today, the Quest Business Intelligence Studio can attach to the data hub, and allows you to graphically explore you data using drag and drop, click and drilldown paradigms:

It’s great to be living in Australia – one of the lowest homicide rates!

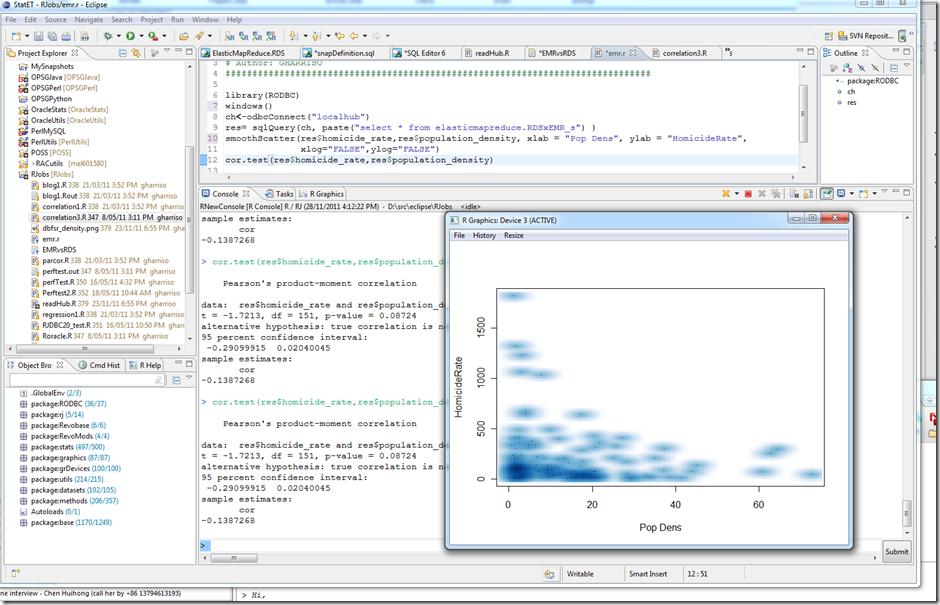
If you’re a hard core data scientist, you can even attach R through to the hub via the RODBC interface.  So for instance, in the screen shot below, I’m using R to investigate the correlation  between population density and homicide rate.  The data comes from Hive (EMR) and Oracle (RDS),  is joined in the hub, saved as a snapshot and then feed into R for analysis.  Pretty cool for a crusty old stats guy like me (My very first computer program was written in 1979 on SPSS).

image

Page 1 ... 4 5 6 7 8 ... 20 Next 5 Entries »